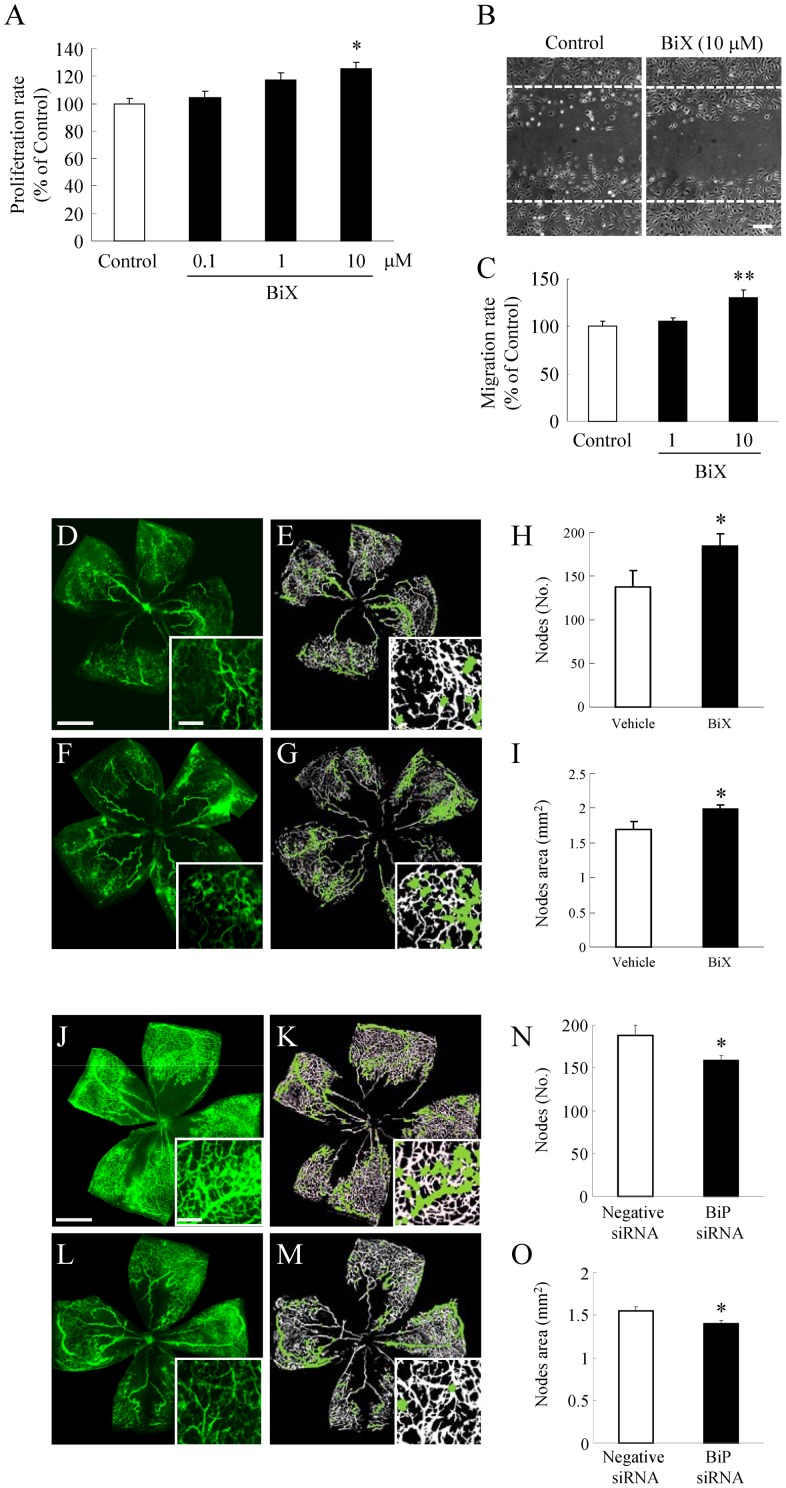
Figure 8. BiP protein levels regulates retinal neovascularization.
(A) HRMEC were cultured in a 96-well plate (at a density of 2×10³ cells/well), and were then supplemented with the indicated concentrations of BiX for 1 h, and measurements were made by WST-8 assay. Data are shown as mean ± S.E.M. (n = 6). *, p<0.05 vs. Control (Dunnett's multiple-comparison test). Migration of HRMEC was assessed using a wound-healing assay. (B) Images of the wounded monolayer of HRMEC were taken at 24 h after treatment for 1 h with BiX. (C) The indicated concentrations of BiX increased migration compared to the control. Scale bars indicate 500 µm. Data are shown as mean ± S.E.M. (n = 4). **, p<0.01 vs. Control (Dunnett's multiple-comparison test). The original images (D, F and J, L), together with the analyzed images (E, G and K, M) obtained using the Angiogenesis Tube Formation module in Metamorph, are shown. Scale bars indicate 500 µm and 100 µm (in box). Quantitative analysis was performed on the entire retinal microvasculature in flat-mounted retinas obtained at P17. BiX at 1 µM and BiP small interfering (si) RNA at 1 µg/mL increased (vs. vehicle) both the number of nodes (E, K) and the node areas (F, L), which are indexes of pathological neovascularization as calculated using the Angiogenesis Tube Formation module. Data are shown as mean ± S.E.M. (n = 4 or 5). *, p<0.05 vs.Vehicle (Student's t-test).

