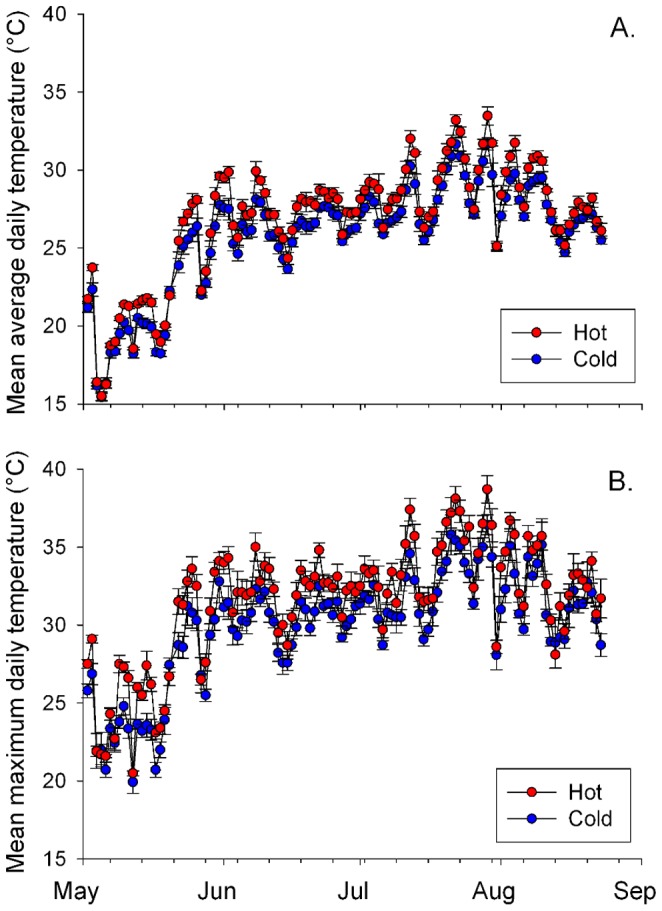
Figure 3. Average and maximum temperature differences between hot and cold sites.

Temperatures recorded on ibuttons at ‘hot’ and ‘cold’ sites in Raleigh, NC May 2, 2011- August 23, 2011. Dots represent mean (±SEM) a) average daily temperature (°C) and b) mean maximum daily temperature at hot and cold sites. Average daily mean temperatures were significantly higher at hot sites (F 1, 10 = 7.90, P = 0.0185), as were mean daily maximum temperatures (F 1, 10 = 6.42, P = 0.0297). The extent of the difference between average (F 112, 1120 = 1.96, P<0.0001) and maximum daily temperatures (F 112, 1120 = 1.23, P = 0.0583) depended on time of year.
