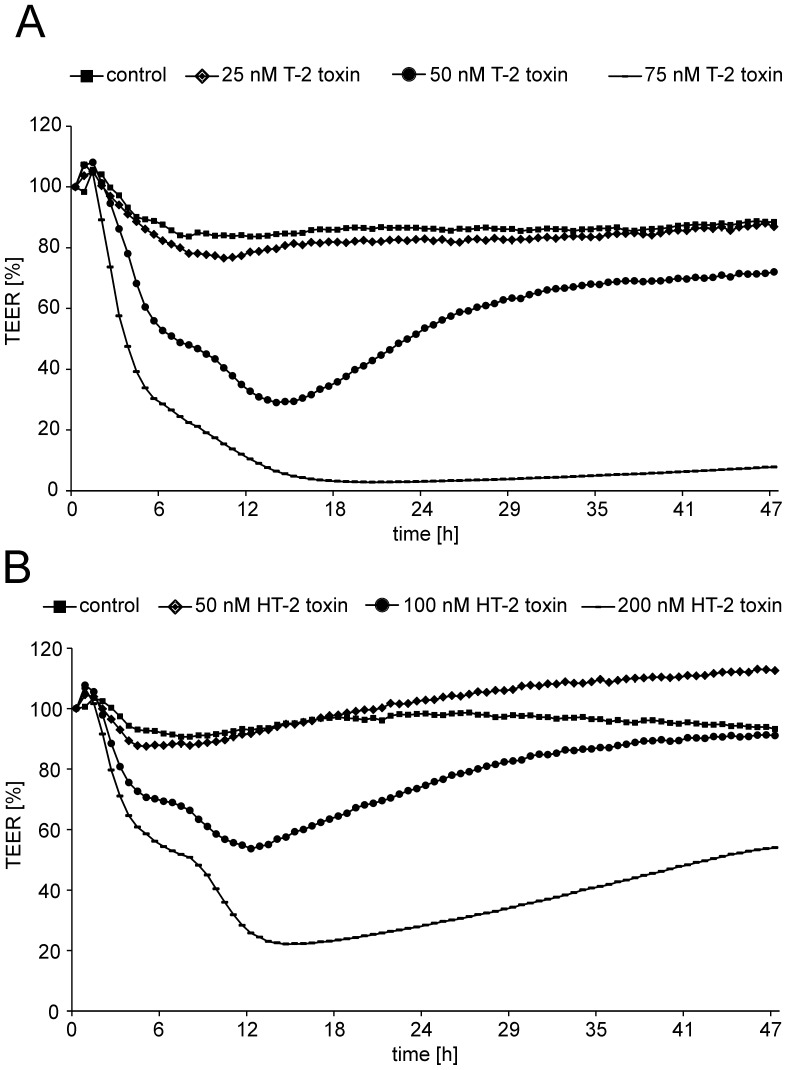
Figure 3. Effects of T-2 and HT-2 toxin on barrier function of PBCEC over 48 h.
A: TEER measurements after incubation of various concentrations of T-2 toxin from the apical side to PBCEC monolayers. B: Results of TEER measurements after incubation of different HT-2 toxin concentrations from the apical side to PBCEC monolayers. all: n = 9 with standard deviations 10 – 15% (not shown).

