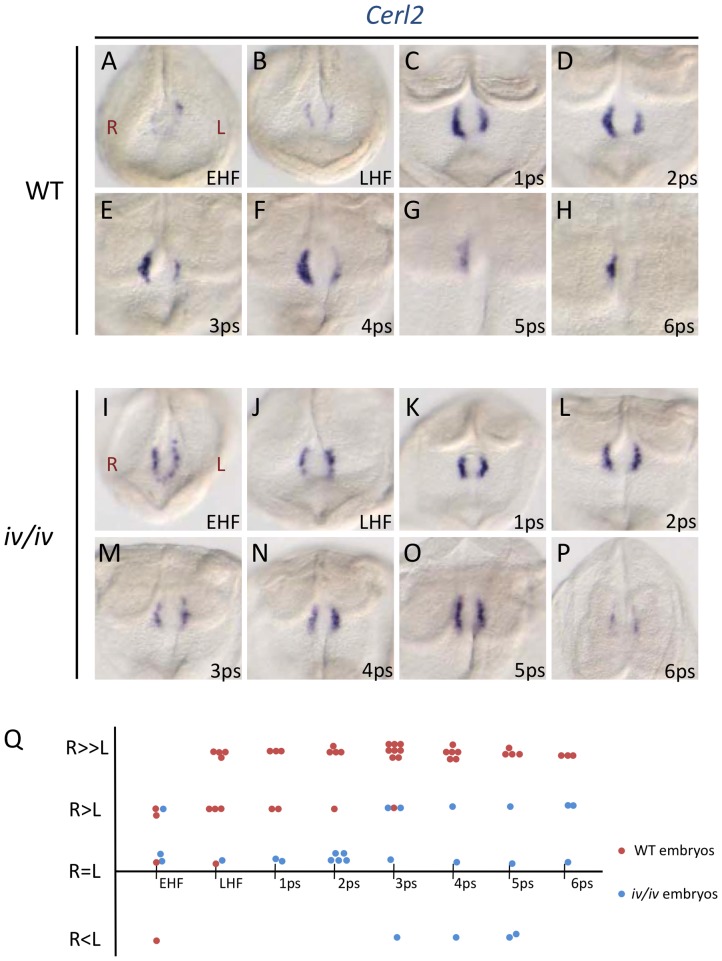
Figure 3. Time course and pattern of Cerl2 RNA expression during early somitogenesis.
Representative patterns of Cerl2 RNA expression in the node of wild-type (A–H), and iv/iv (I–P) embryos at different developmental stages. (Q) Difference in the level of Cerl2 RNA expression between the left and right sides of embryos at different developmental stages of the indicated genotypes: wild-type-red circles; iv/iv-blue circles. Each circle represents one embryo.

