
Figure 4. Comparison of WT-1 expression and presence of proteinuria (ACR) in diabetic patients at various eGFR cutoffs.
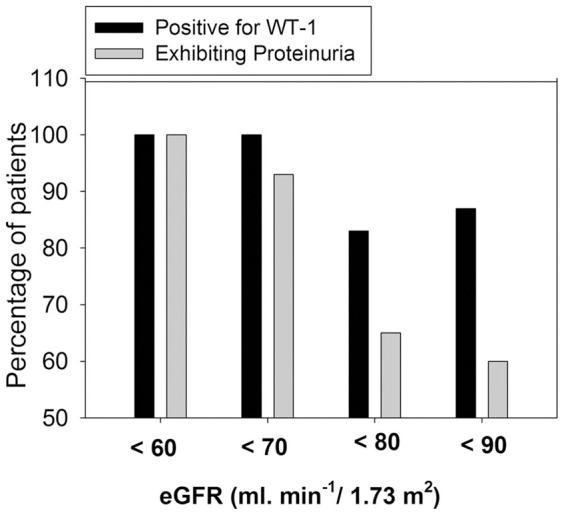
Bar graph showing percentage of patents detected with proteinuria or WT1 expression in urinary exosomes at various cutoff values of eGFR between 60–90 ml. min−1/1.73 m2). WT-1 expression was detected in higher percentage of patients at earlier fall in GFR (eGFR<70/80/90 ml. min−1/1.73 m2).