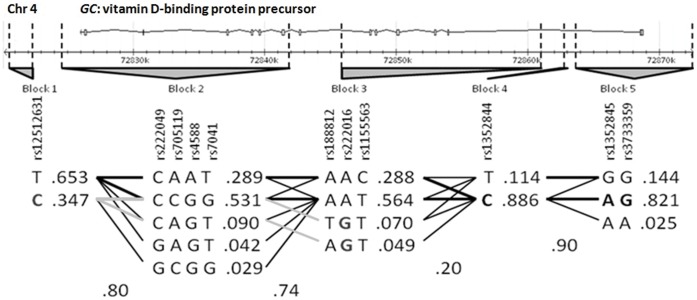
Figure 1. Haplotype distribution within GC gene according to Tag-SNPs selected by Haploview v4.2.
Genotyped SNPs are indicated by their rs#. LD Blocks are shown in gray. GC gene chromosomic location and ideogram in reverse orientation appears on the top of the figure, where boxes represent exons and horizontal black lines introns. Bold denotes associated risk alleles, and light grey lines indicate connected haplotypes.

