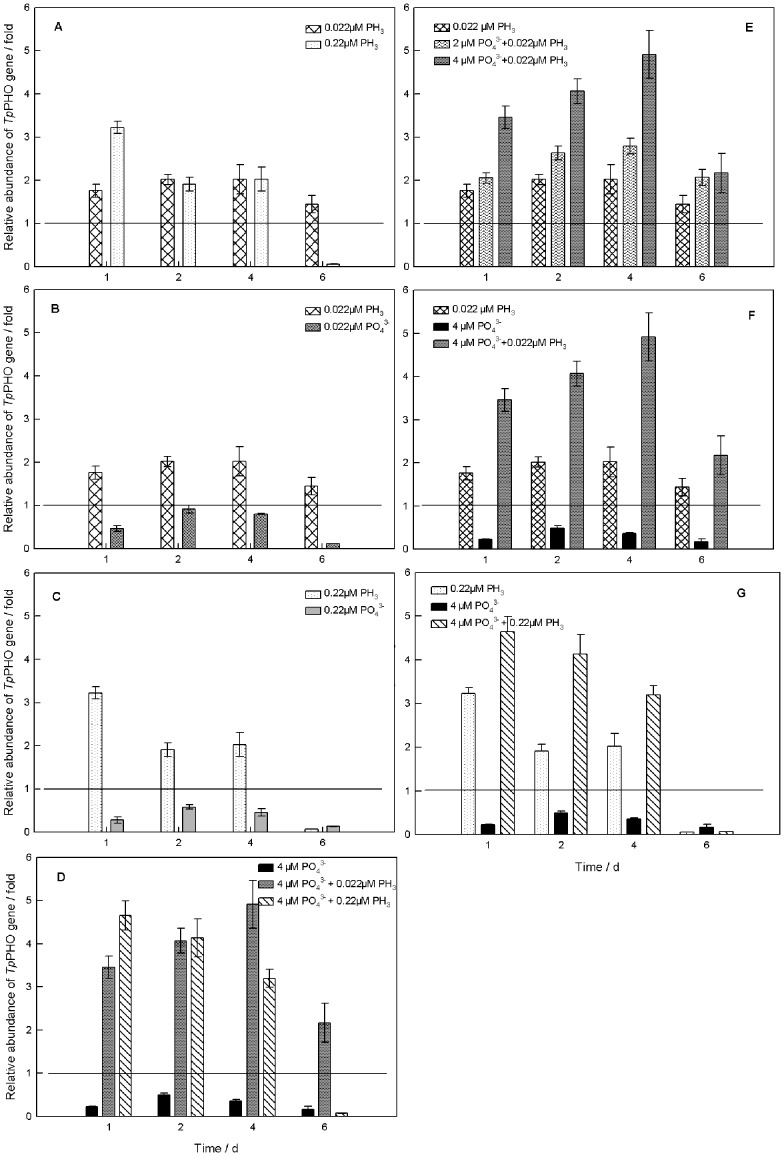
Figure 3. Effects of phosphine on transcriptional level of TpPHO in T. pseudonana.
The horizontal lines show that the relative abundance of TpPHO in the control (reference group) was 1 fold. (A) Under the phosphate-deficient condition, different concentrations of phosphine were introduced. (B) Under the phosphate-deficient condition, the same low concentrations (0.022 µM) of phosphine and phosphate were added. (C) The same high concentrations (0.22 µM) of phosphine and phosphate were added, respectively, under the phosphate-deficient condition. (D) Different concentrations of phosphine were added under the phosphate-4 µM condition. (E) The low concentration (0.022 µM) of phosphine was introduced into cultures with different initial concentrations of phosphate. (F) and (G) Phosphine and phosphate have a synergistic effect. For all treatments, the first sampling occurred at 24 h (day 1) after the first addition of phosphate and/or phosphine, which was 48 h after inoculation. The error bars represent standard deviations.

