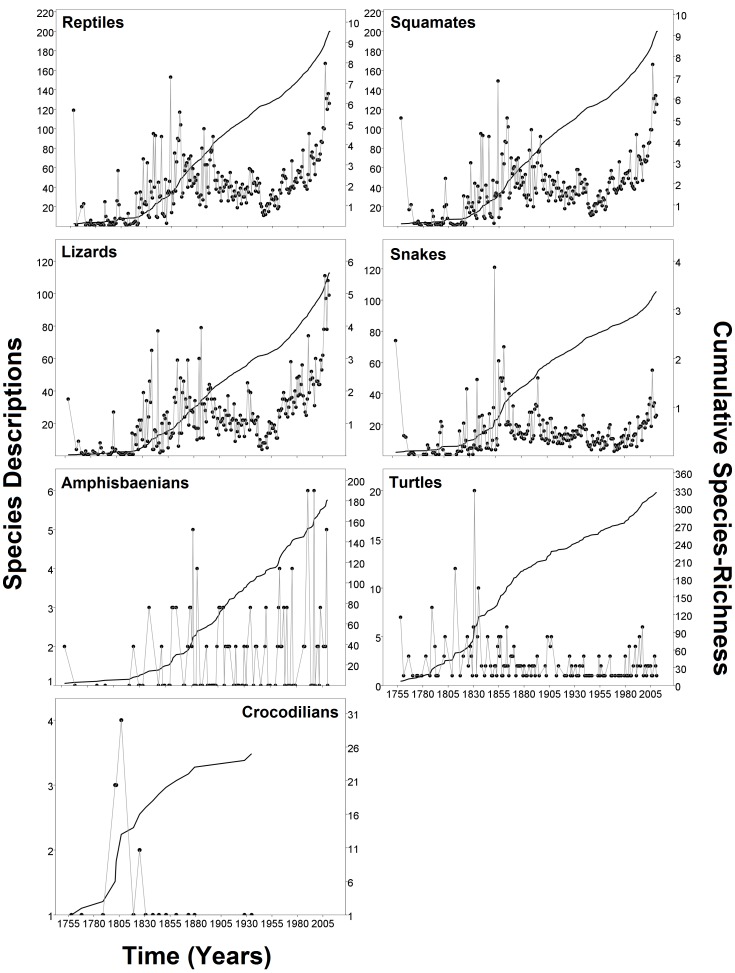
Figure 2. Historical rates of reptile species descriptions (dots) and rate of accumulation of new species (continuous line) since Linnaeus (1758), to the most recent species appeared to March 2012.
The two top plots show rates for reptiles as a whole and for the squamate clade, respectively, while the remaining ones focus on major reptile groups. The tuatara is not shown given the single-species richness of the order Rhynchocephalia. The time scale shown in the bottom plots is identical to the timescales of the plots above them.

