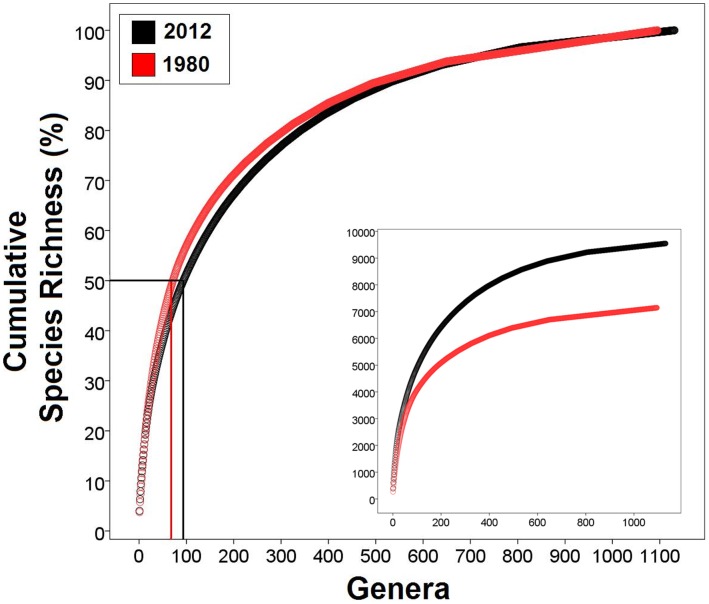
Figure 5. Distribution of the world’s reptile species as the accumulation of relative diversity from the richest (Anolis) to the poorest genera based on a 2012 and a 1980 dataset (main plot).
The 2012 relationship reveals that 50% of global reptile diversity is accounted for by the 93 richest genera only, all of them squamates, and 92 being lizards and snakes. The inset plot displays the accumulation of species for both datasets as absolute species numbers per genera. Anolis is treated as a single large genus (see text for details).

