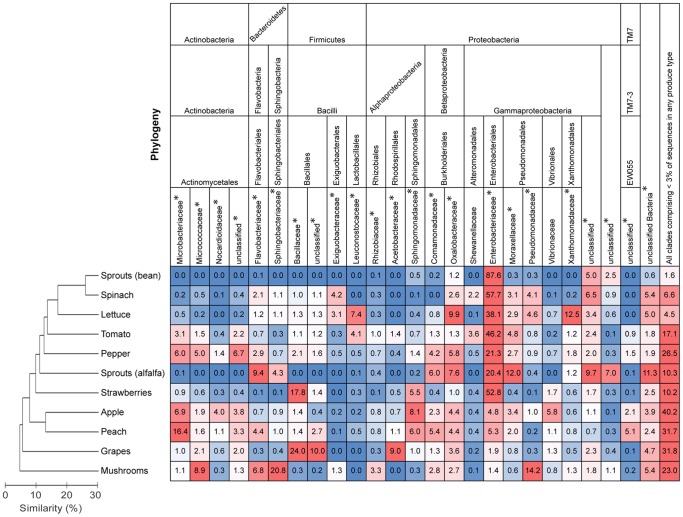
Figure 2. Relationships between bacterial communities on each produce type and relative abundances of bacterial families.
The dendrogram is based on mean Bray-Curtis dissimilarities and shows differences among produce types in the overall composition of the bacterial communities. The heatmap shows mean relative abundances (%) of bacterial families on produce types. Only families and unclassified groupings representing at least three percent on any produce type are represented.

