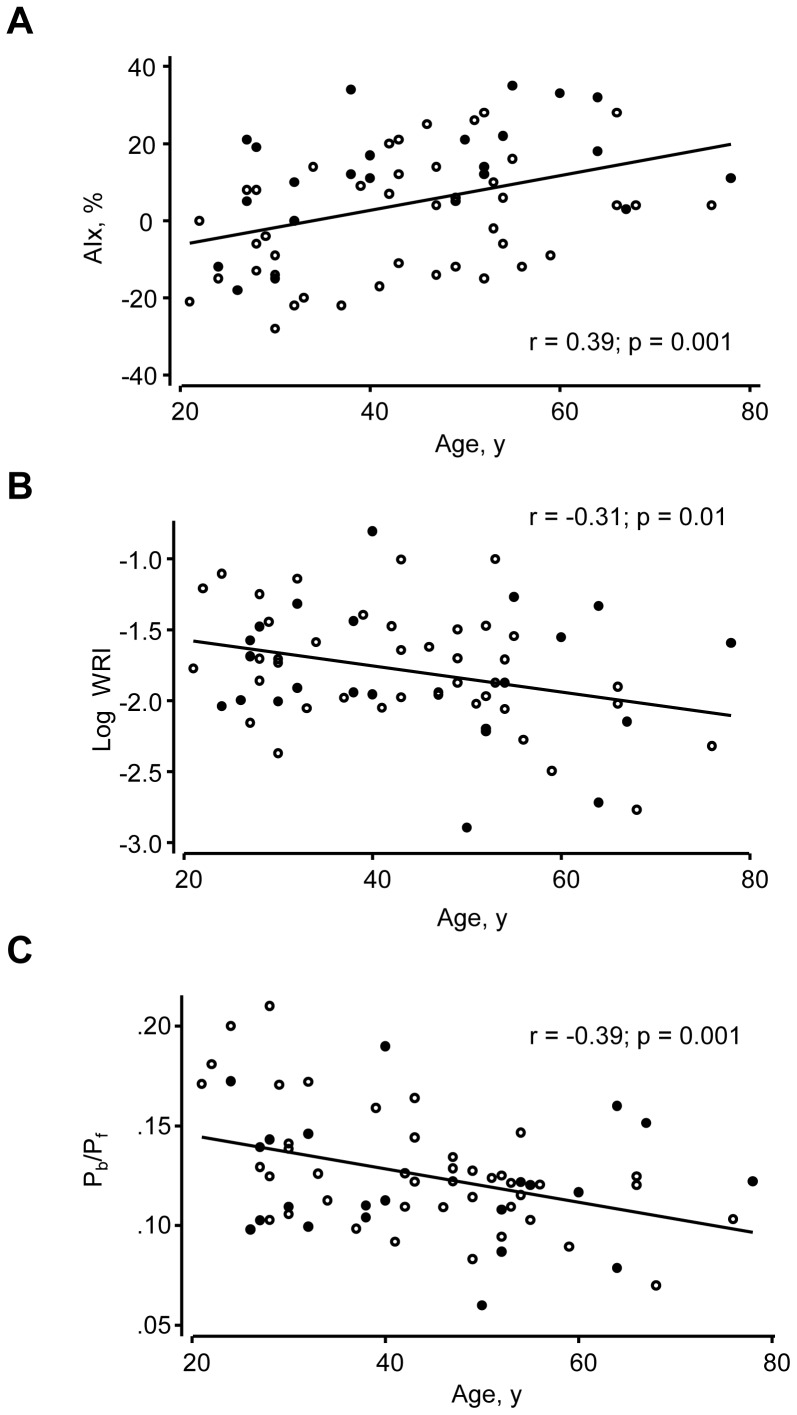
Figure 3. Scatterplots of the relationship between age and various indices.
A) Age vs. AIx B) Age vs, Log wave reflection index (WRI) and C) Age vs. peak backward/peak forward pressure (Pb/Pf). Regression lines are derived from data pooled by gender but data points for men (○) and women (•) are indicated separately.

