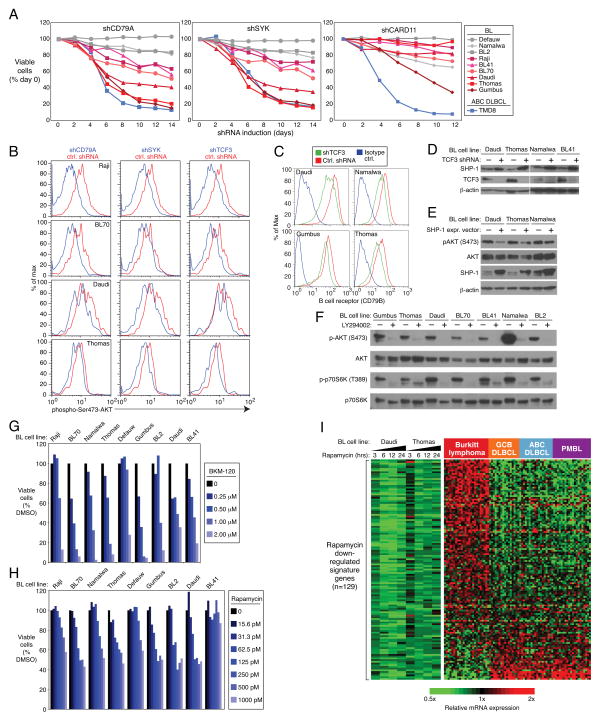
Figure 3. PI(3) kinase activity in Burkitt lymphoma.
a, CD79A and SYK knockdown is toxic for a subset of BL cell lines. Vectors co-expressing either CD79A or SYK shRNAs together with GFP were transduced into the indicated cell lines. shRNA expression was induced for the indicated times and the fraction of live GFP+, shRNA+ cells was normalized to the value on day 0. BCR-dependent BL lines are depicted using red colors. The BCR-dependent ABC DLBCL line TMD813 is also shown. Data represent at least three independent experiments. b, Knockdown of CD79A, SYK or TCF3 reduces PI(3) kinase activity. The indicated BL cell lines were transduced with a control shRNA or shRNAs targeting CD79A, SYK, or TCF3. shRNA expression was induced for 2 days, and cells were analyzed by FACS for phospho-S473-AKT staining as a measure of PI(3) kinase activity. c, TCF3 regulates expression of the B cell receptor (BCR) in BL. An shRNA targeting TCF3 or a control shRNA was induced in the indicated BL cell lines for 1 day. Surface expression of the BCR was quantified by FACS analysis of the BCR subunit CD79B. d, TCF3 suppresses PTPN6 (SHP-1) expression. The indicated BL cells were transduced with an shRNA targeting TCF3 and analyzed by Western blot analysis for the indicated proteins. e, Ectopic expression of SHP-1 suppresses phospho-S473-AKT in BL cell lines. Indicated cell lines were transduced with SHP-1 expression vector (+) or an empty vector control (−), whereupon cells were subjected to Western Blot analysis of indicated proteins. f, BL cell lines have constitutively high levels of PI(3) kinase activity. Western blot analysis of BL cell lines revealed high levels of phospho-S473-AKT and phospho-T309-p70S6K, which were reduced by treatment with the PI(3) kinase inhibitor LY294002, as indicated. g, Inhibition of PI(3) kinase activity is toxic to BL cell lines. Shown are viable cells, as quantified by MTS assay, in cultures of BL lines treated with indicated concentrations of the pan-class I PI(3) kinase inhibitor BKM120. h, Inhibition of mTOR activity is lethal to most BL cell lines. Shown are viable cells, as quantified by an MTS assay, in cells treated with the indicated concentrations of rapamycin. i, Genes down regulated by Rapamycin are highly expressed in BL. Changes of gene expression were profiled in BL cell lines following Rapamycin (100 pM) addition for indicated time points. Shown are genes that were downregulated by at least 0.4 log2 in at least 3 of 4 time points in both cell lines. Previously published gene expression profiling datasets from BL, GCB DLBCL, and ABC DLBCL were used5.

