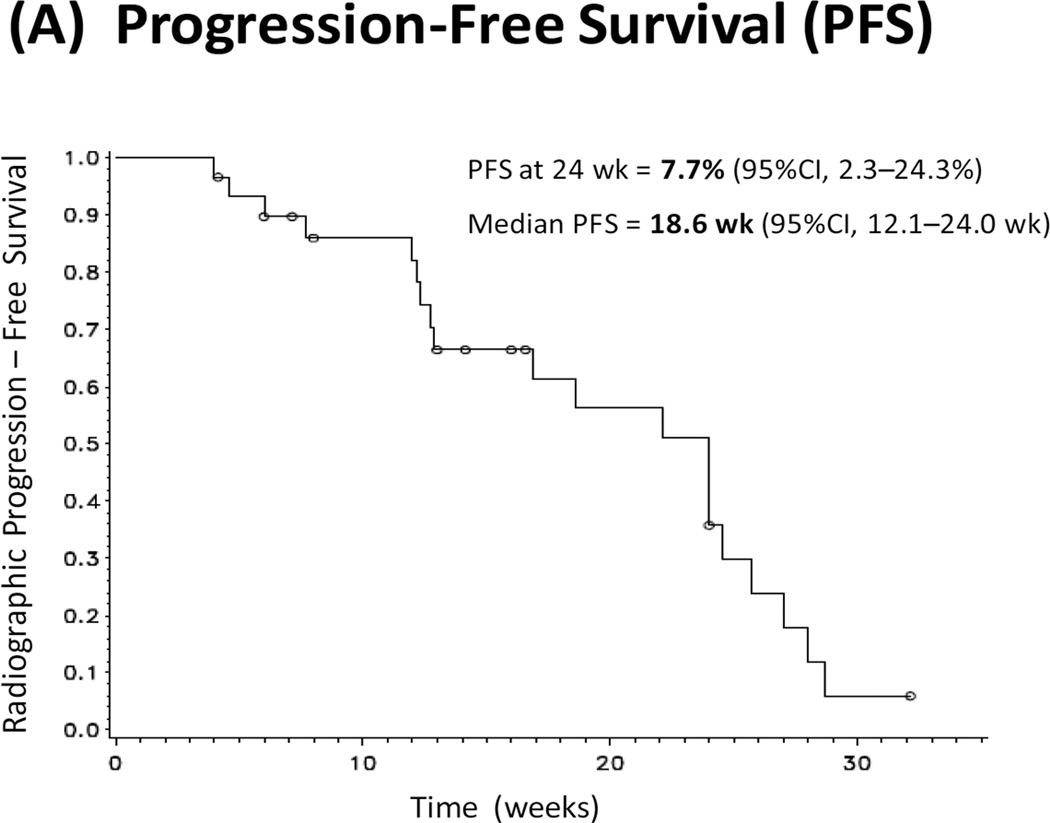
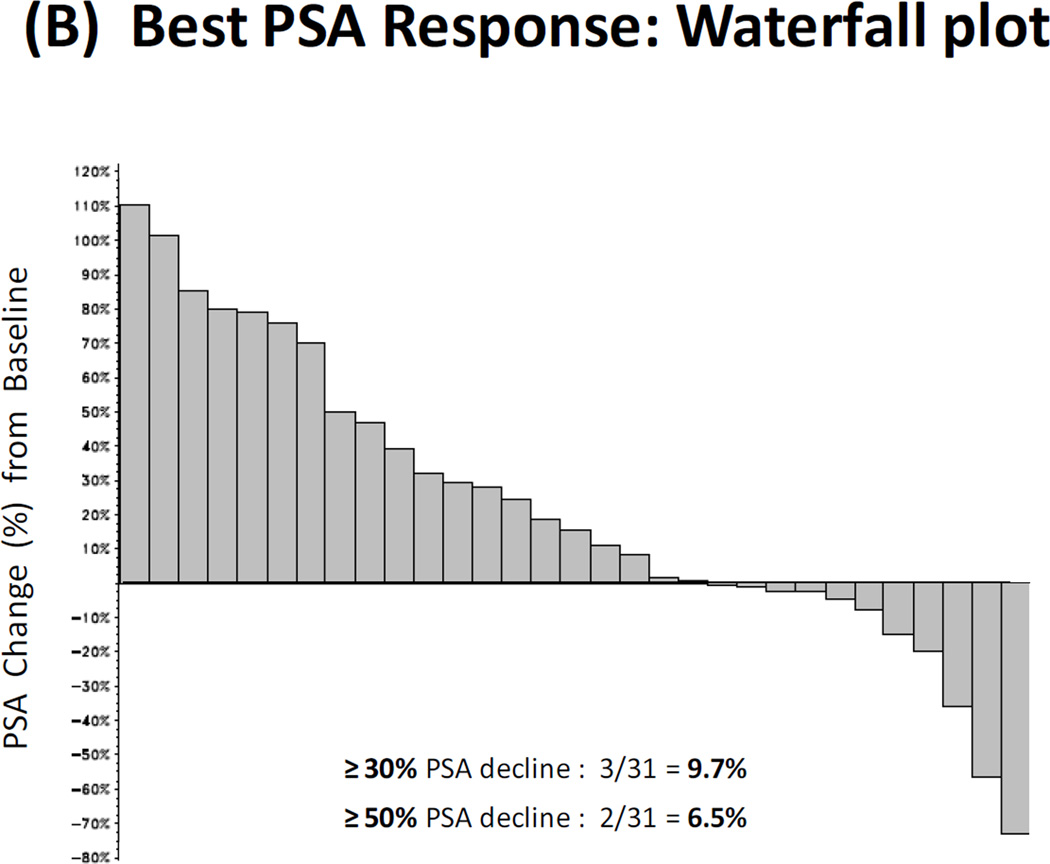
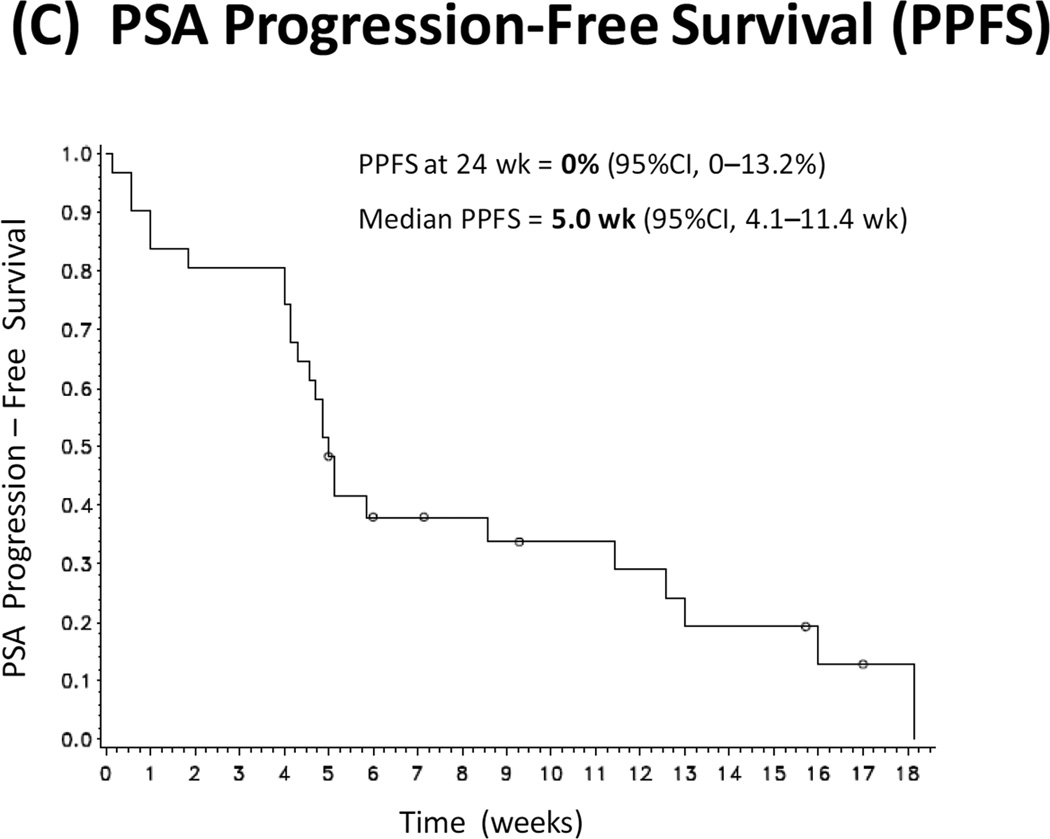
Figure 1. Clinical Outcomes.
(A) Kaplan-Meier curve depicting radiographic progression-free survival (PFS). Progression is defined according to the PCWG2 criteria. (B) Waterfall plot showing best PSA response. Each bar represents the percentage change in PSA from baseline in an individual patient. (C) Kaplan-Meier curve depicting PSA progression-free survival (PPFS). PSA progression is defined as a confirmed ≥25% increase in PSA from nadir.


