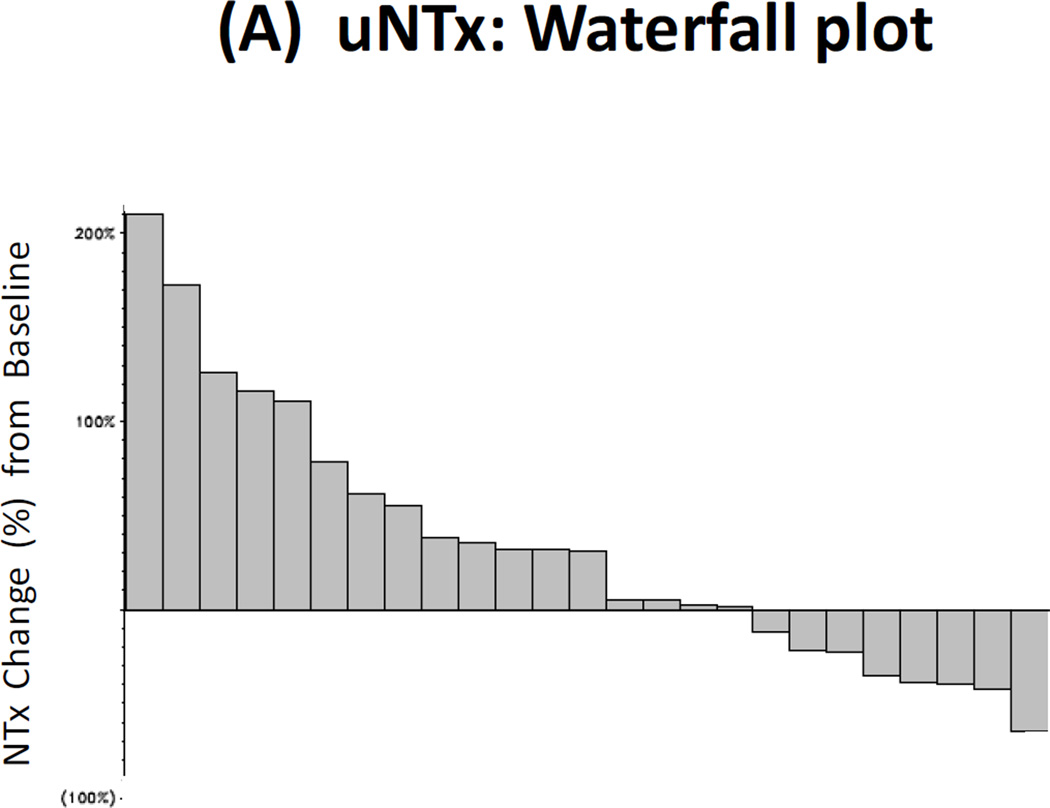
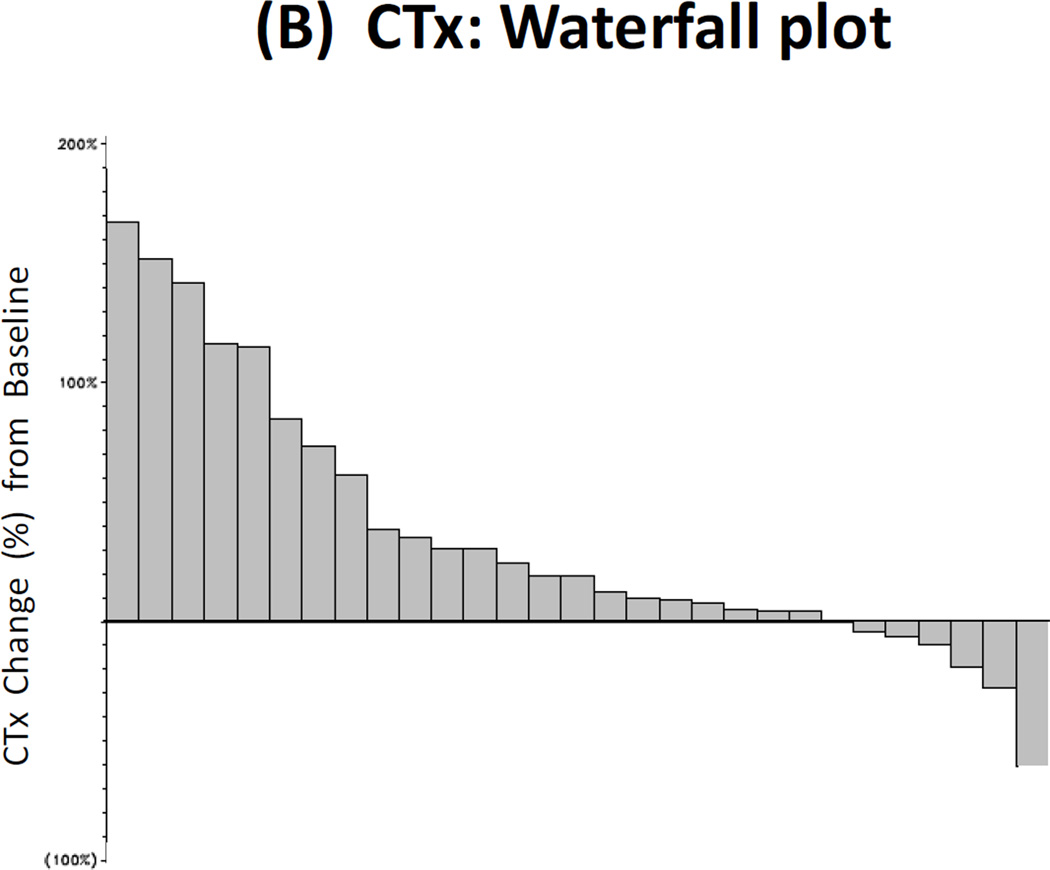
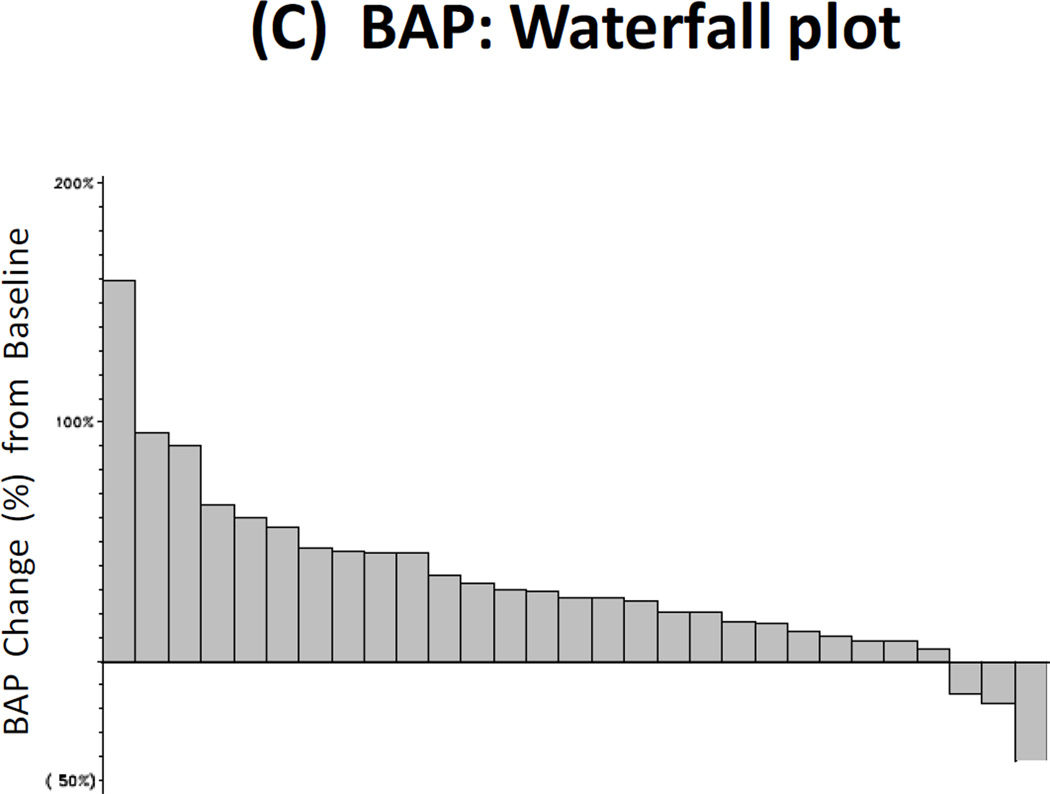
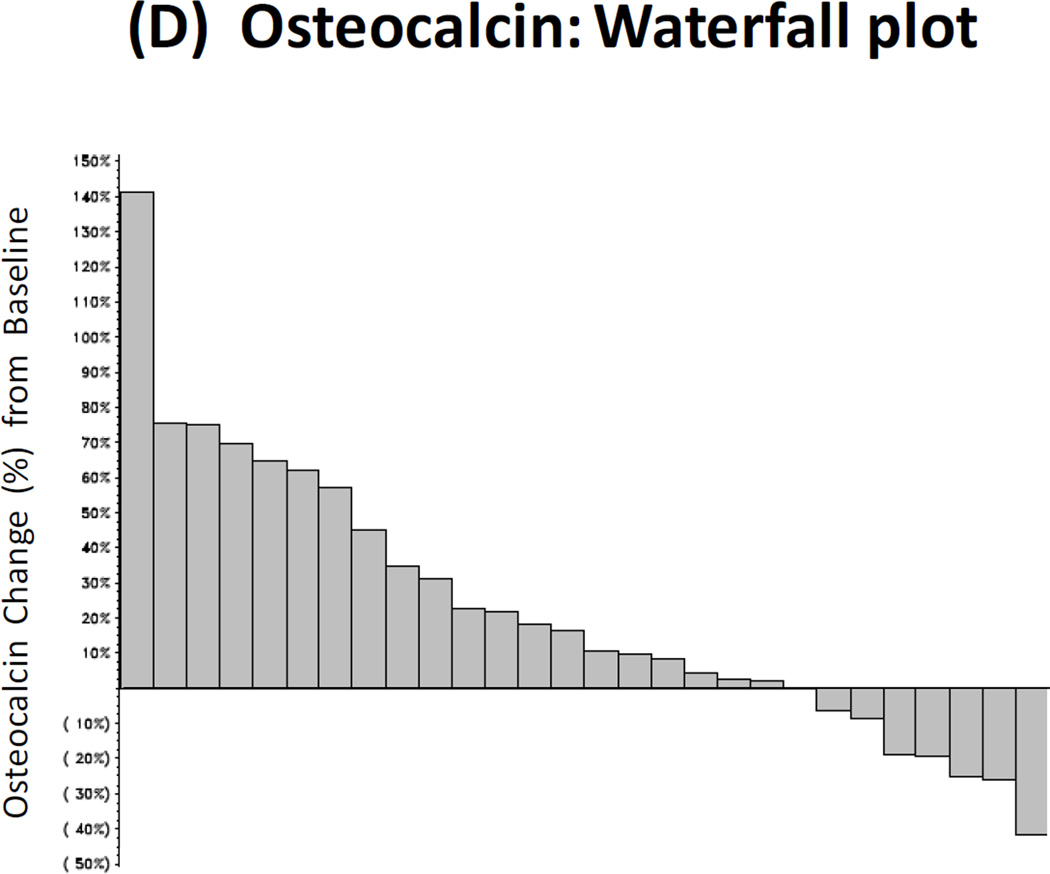
Figure 2. Bone Biomarker Outcomes.
(A) Waterfall plot showing best treatment response in urinary N-telopeptide (uNTx), a marker of bone resorption. (B) Waterfall plot showing best treatment response in serum C-telopeptide (CTx), a marker of bone resorption. (C) Waterfall plot showing best treatment response in serum bone alkaline phosphatase (BAP), a marker of bone formation. (D) Waterfall plot showing best treatment response in serum osteocalcin, a marker of bone formation.


