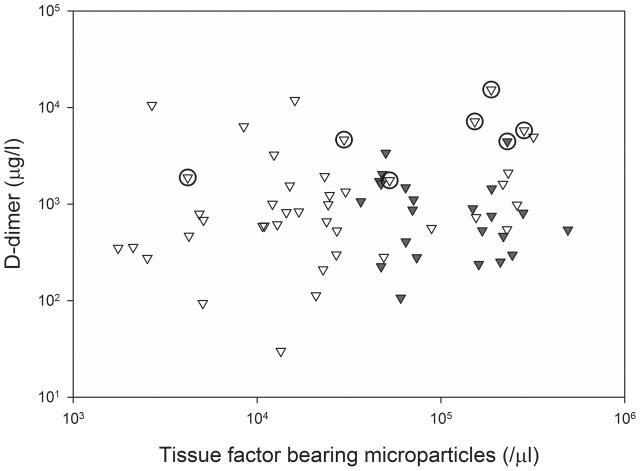
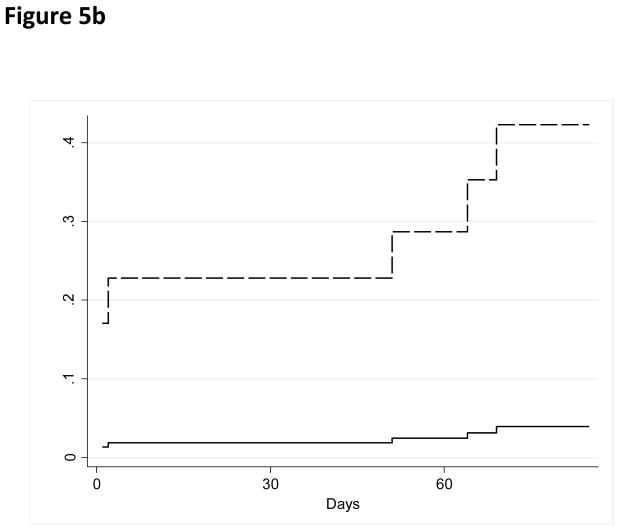
Figure 5. Correlation between concentration of tissue factor-bearing microparticles and D-dimer with VTE.
a) Baseline concentration of tissue factor-bearing microparticles did not correlate with D-dimer values (Spearman coefficient 0.10). Dark triangles represent subjects randomized to enoxaparin and open triangles represent subjects followed without anticoagulation. The open circles represent subjects diagnosed with a VTE primary endpoint (including a study subject diagnosed with VTE prior to randomization). b) Cumulative incidence of VTE for subjects with very elevated D-dimer values (>1500 μg/l) and higher tissue factor-bearing microparticles (N=12, dashed line) compared with all other study subjects (N=55, Gray’s test P value=0.0001, solid line).


