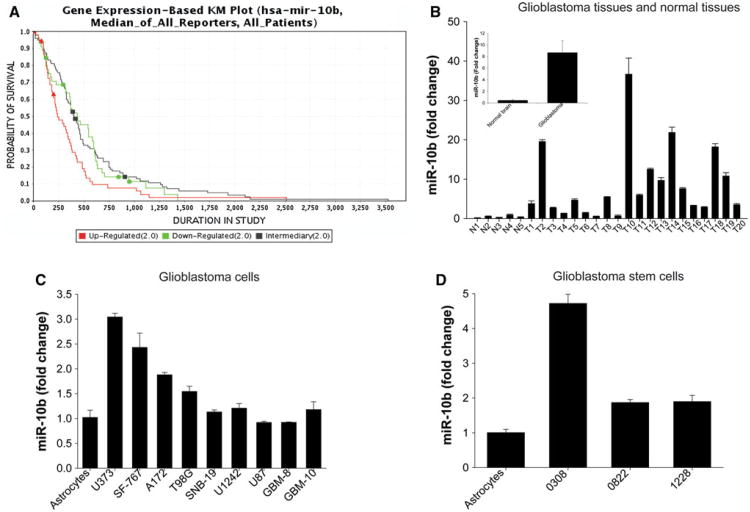
Fig. 1.
miR-10b is upregulated in GBM specimens, tumor cell lines and cancer stem cell lines (GSC), and expression levels correlate with patient survival. a Gene expression-based Kaplan–Meier plot shows an inverse correlation between miR-10b levels and patient survival. b miR-10b levels were measured by quantitative RT-PCR in GBM tissues (T), normal brain (N), normal human astrocytes, GBM cell lines (A172, U87, U373, SNB19, T98G, SF767, U1242), primary GBM cells (GBM8 and GBM10) and GSCs (0308, 0822,1228). The results show that average levels of miR-10b in GBM tissues were significantly higher than normal brain tissues (p < 0.01). c miR-10b levels in U373, SF767, A172, and T98G GBM cell lines were significantly higher than in astrocytes (p < 0.05). d miR-10b levels in GSCs were significantly higher than in astrocytes (p < 0.05)

