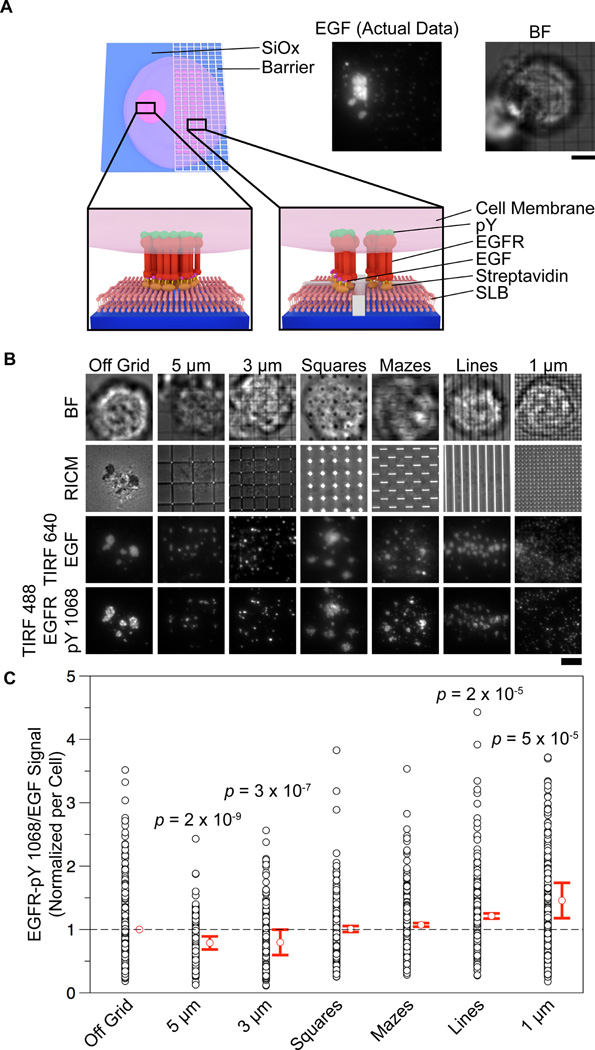
Figure 2. Lipid diffusion barriers limit EGFR clustering and allow quantification of the relationship between cluster size and activation level.
(A) Scheme illustrating a cell that interacts with a patterned and non-patterned region of a supported lipid membrane juxtaposed with a fluorescence image of the EGF organization under a cell on the border of a 3 µm nanopatterned grid functionalized supported lipid bilayer. Scale bar is 5 µm. (B) Representative images of cells in the BF, RICM, TIRF 640 (EGF), and TIRF 488 (EGFR-pY 1068) channels interacting with nanopatterns (or non-patterned areas) on a supported lipid bilayer functionalized with EGF. Barriers directly controlled cluster size and pattern according to their respective dimensions and shapes. (See Supplementary Fig. 5 for cluster size histograms). Image contrast levels have been adjusted to illustrate cluster size for each representative image. Scale bar is 5 µm. (C) Vertical scatter plot showing the relationship between feature size and EGFR-pY 1068/EGF ratio. Ratios were taken from the mean intensities of the TIRF 488 (EGFR-pY 1068) and TIRF 647 (EGF) channels (see methods and Supplementary Figure 3 for data processing details). The p values listed for the 5 µm, 3 µm, 1 µm, and line control features correspond to a Student’s t-test between the given feature and the off-grid control. n = 401, 206, 210, 418, 245, 221, and 243 cells for the off-grid, 5 µm, 3 µm, 1 µm, square control, maze control, and 2 µm lines, respectively.

