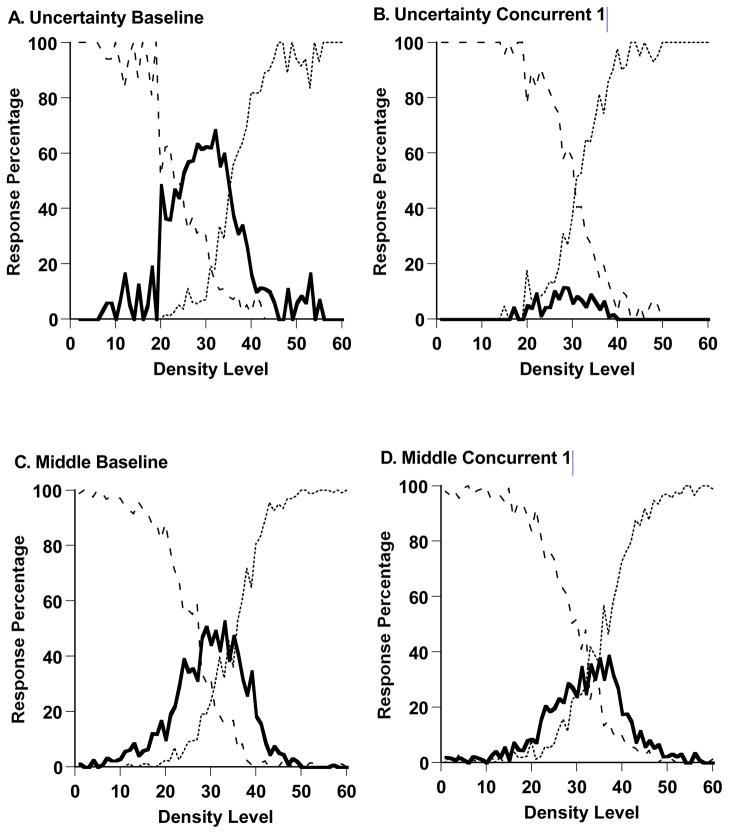
Figure 14.
A,B. Percentage of uncertainty responses (solid line), sparse responses (dashed line), and dense responses (dotted line) made by macaques Murph and Lou in their baseline performance and in their first phase of concurrent-load testing. C,D. Percentage of middle responses (solid line), sparse responses (dashed line), and dense responses (dotted line) made by macaques Hank and Gale in their baseline performance and in their first phase of concurrent-load testing.

