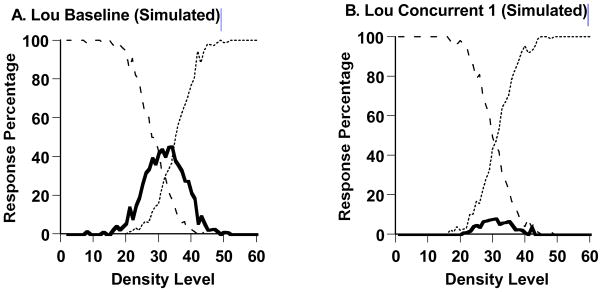
Figure 6.

A. The best-fitting predicted performance profile to the macaque Lou’s performance (Figure 5A) in a Sparse-Uncertain-Dense task with no concurrent shape-memory requirement. The percentages of uncertainty responses (solid line), sparse responses (dashed line), and dense responses (dotted line) are shown. The data were fit using formal-modeling procedures specified in the text. B. The best-fitting predicted performance profile to the macaque Lou’s performance (Figure 5B) in a Sparse-Uncertain-Dense task with a concurrent shape-memory requirement. The data were modeled and are depicted in the same way.
