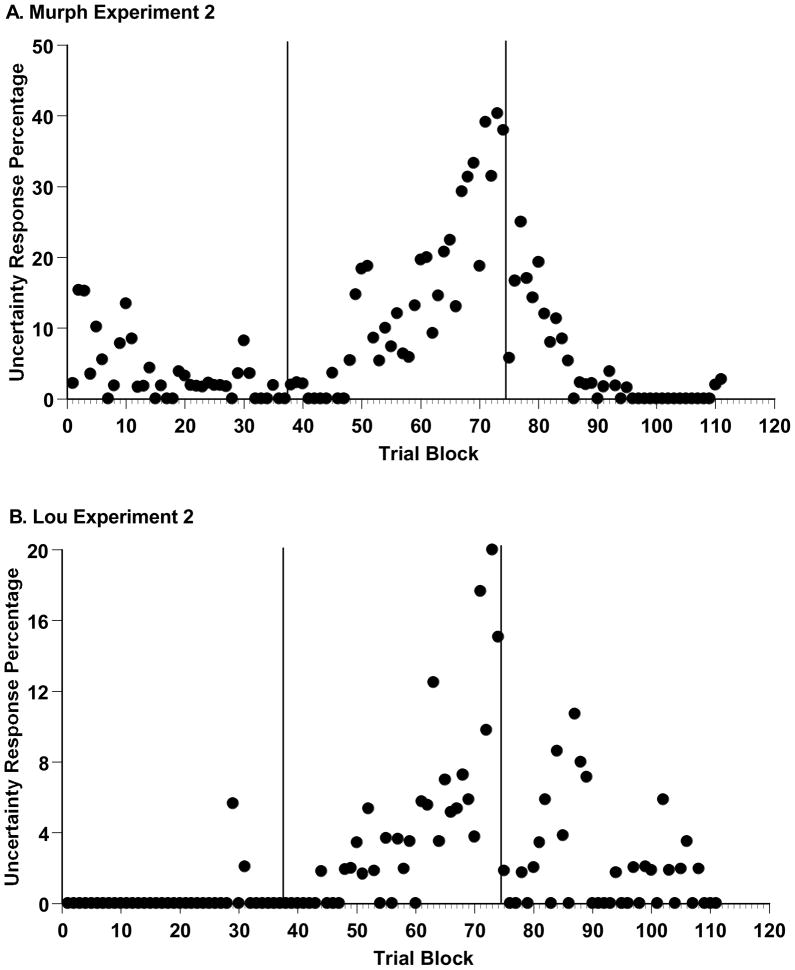
Figure 8.
A. Murph’s uncertainty-response percentage for trial levels 21–40, by sequential trial block in the three phases of Experiment 2 (from left to right: concurrent-load 1, control 1, concurrent-load 2). The Y-axis is scaled to his maximum uncertainty-response percentage. B. Lou’s uncertainty-response percentages, depicted in the same way.

