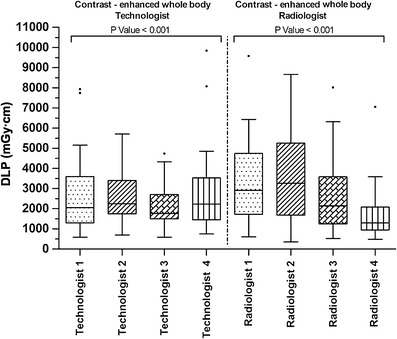
Fig. 2.

DLP values of contrast-enhanced whole-body CT examinations sorted by performing technologists and radiologists at centre 4. The box plot diagram shows the distribution of median, interquartile range, minimum and maximum, and outlier observed values. DLP values are expressed in mGy∙cm
