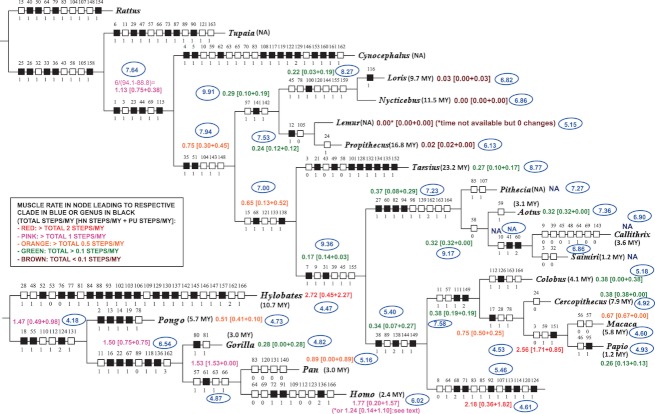
Fig. 2.
Single most parsimonious tree shown in Fig. 1, the muscle evolutionary rates [number of total unambiguous character state changes as well as of unambiguous HN (chars. 1–67) and PU (chars. 68–166) character state changes per 1 million years (1 MY)] for each node within the primate clade and for the node leading to the Primatomorpha being given next to these nodes. For comparison, the nucleotide substitution rates (unit = number of substitutions/site/MY × 104; see text for more details) calculated by Perelman et al. (2011) is shown inside a blue oval next to each node (for more details, see text).

