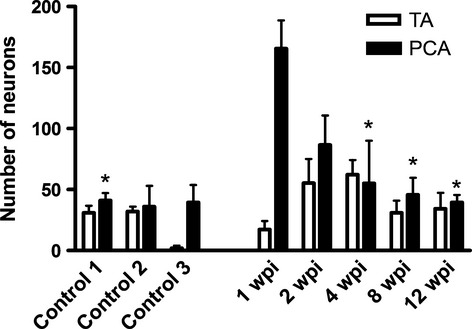
Fig. 2.

Histogram showing the mean number of labeled motoneurons present in control animals and in animals allowed to survive for different times following laryngeal nerve crush injury (wpi, weeks post-injury). Error bars: standard error of mean. *Statistically significant differences to 1 wpi (P < 0.01). PCA, posterior cricoarytenoid; TA, thyroarytenoid.
