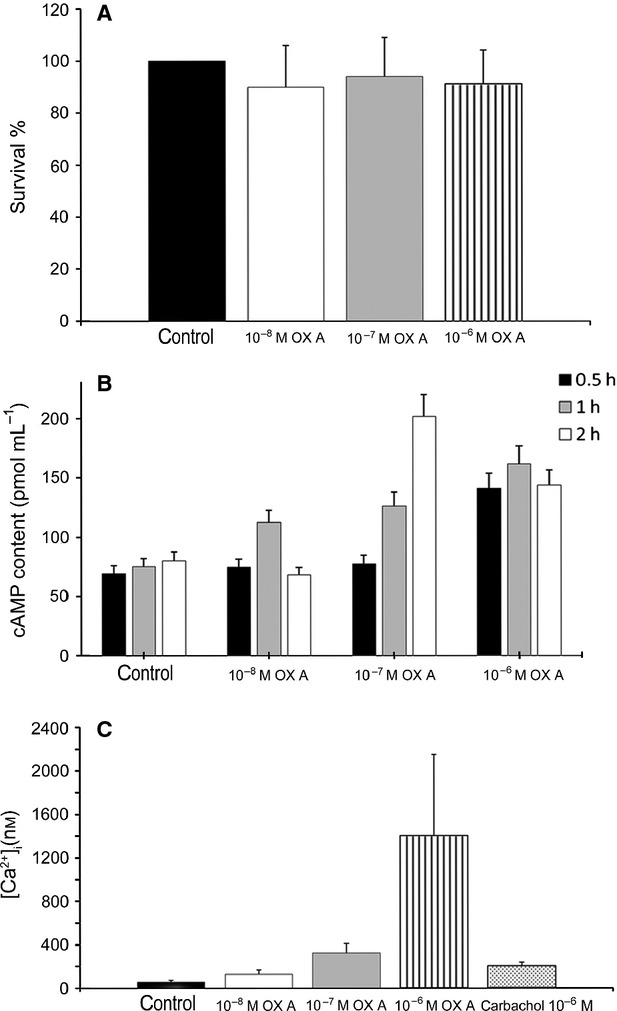
Fig. 4.

Effects of different OXA concentrations on PNT1A cells. (A) Results from MTT-based cell proliferation assay. The data, expressed as mean ± SEM of four independent experiments, are reported as the survival percentage as compared with control cells, after 24 h of OXA administration. (B) cAMP production induced by OXA at different time intervals. Data are expressed as mean ± SEM of three independent experiments: 0.5 h 10−6 m compared with control, P < 0.05; 1 h each dose compared with control, P < 0.05, 2 h 10−7, 10−6 m compared with control, P < 0.05. (C) Intracellular Ca2+ release induced by different OXA doses. Control was calcium-free medium exclusively, other samples were calcium-free. Carbachol 10−6 m was used as positive control. Data are expressed as mean ± SEM of three independent experiments. All experimental groups have a value of P < 0.05 compared with control.
