
Figure 2.
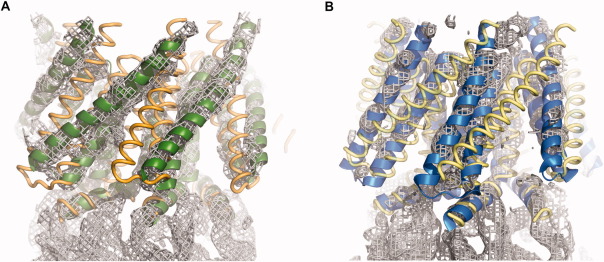
Electron density maps in the transmembrane domain regions of DDM solubilized EcMscS (a) and DDM solubilized HpMscS (b). The electron density maps were calculated following molecular replacement with PHENIX28 using only the cytoplasmic domain to minimize model bias in the TM region, followed by averaging of the density with MAIN.38 The 2OAU and 2VV5 structures are superimposed to illustrate the correspondence between the electron density maps and the nonconducting and open state structures. For DDM solubilized EcMscS (a), the 2VV5 and 2OAU structures are illustrated as green ribbons and gold coils, respectively. For DDM solubilized HpMscS (b), the 2OAU and 2VV5 structures are depicted as blue ribbons and yellow coils, respectively. This figure was created with PyMol.39