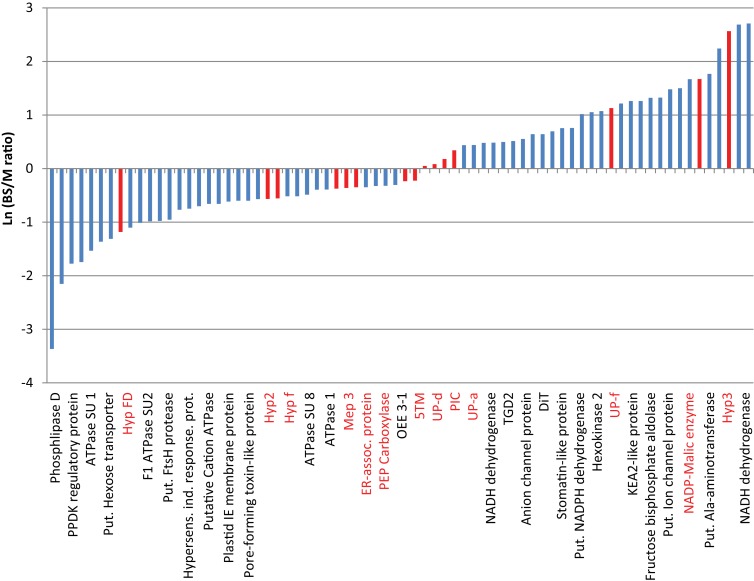
Figure 2.
Differences in the relative abundance of proteins based on the bundle sheath: mesophyll ratio of their spectral ion counts. Data are based on values shown in Tables S3 and S4 in Supplementary Material. Except for known controls, only membrane-associated proteins are integrated. Due to space constrains only ca. 33% of the bars are labeled. The complete protein list and figure are shown in Table S4 in Supplementary Material. Values are the averages from two mesophyll and three BS data sets. Red bars indicate proteins used for further studies.

