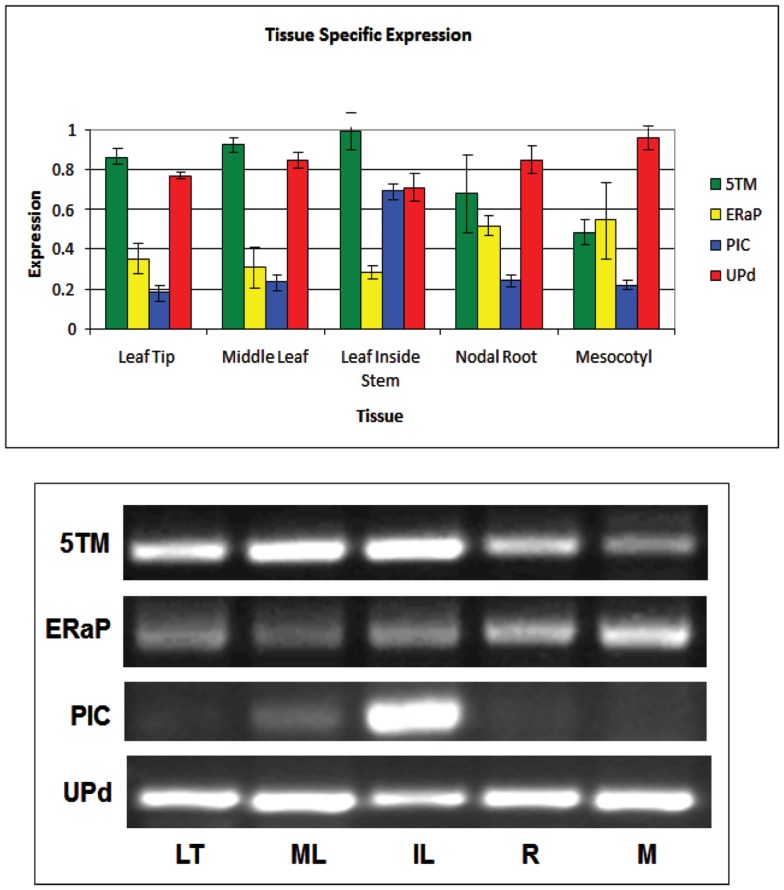
Figure 5.
Quantification of semiquantitative RT-PCR showing tissue-specific expression of genes encoding the 5TM protein (green bars), ER-AP (yellow bars), PIC-like protein (blue bars), and UP-d (red bars). Representative gel pictures are shown in the lower half. Band intensities of three to five biological replicates were quantified and displayed in the bar graph.

