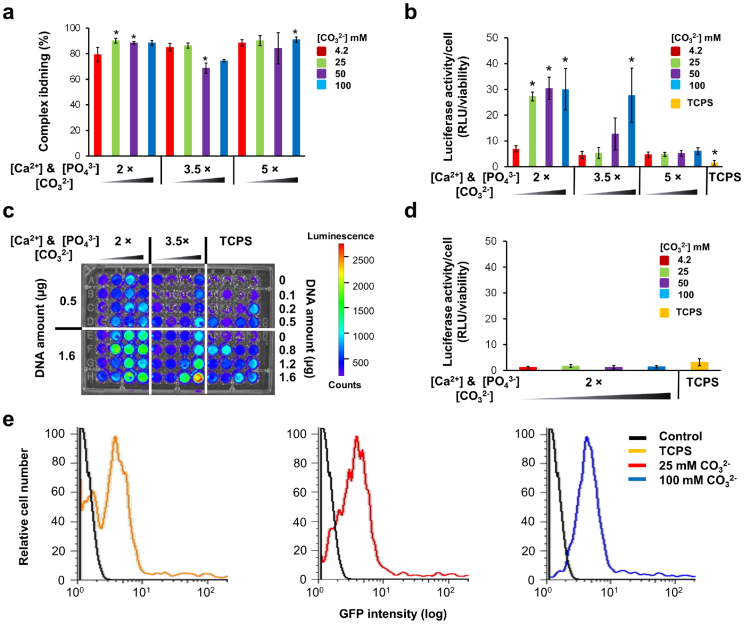
Figure 3. Screening of hMSC transfection on mineral coatings.
(a) pDNA complexes binding on mineral coatings. The binding of the complexes was measured after 5 h incubation on the mineral coatings. * indicates significant difference when compared with Ca/P ratio of CaP mineral coating grown in 2 × mSBF with 4.2 mM of CO32− (red bar at far left) by Student's t-test with p < 0.05. Data represents mean ± SD (n = 4). (b) Luciferase activity of hMSCs after 2 days culture on mineral coatings incubated with 3.2 μg of pDNA complexes. To compare with a standard transfection method, soluble pDNA complexes were also added to hMSCs on tissue culture polystyrene (TCPS). * indicates significant difference compared to 2 × mSBF with 4.2 mM of CO32− (red bar at far left) by Student's t-test with p < 0.05. Data represents mean ± SD (n = 4). (c) Luminescence intensity from cell culture medium after 2 days of hMSC transfection on mineral coatings and TCPS with different amounts of pDNA complexes. (d) Solution based delivery effect on transfection of hMSC on mineral coatings. pDNA complexes were added into cell culture medium after 1 h of cell seeding on mineral coatings formed in 2 × mSBF with various [CO32−]. For a control, hMSCs were grown on TCPS. Data represents mean ± SD (n = 6). (e) Flow cytometric analysis of the distribution of GFP positive cells after transfection on mineral coatings formed in 2 × mSBF with various [CO32−] and TCPS using pEGFP complexes.

