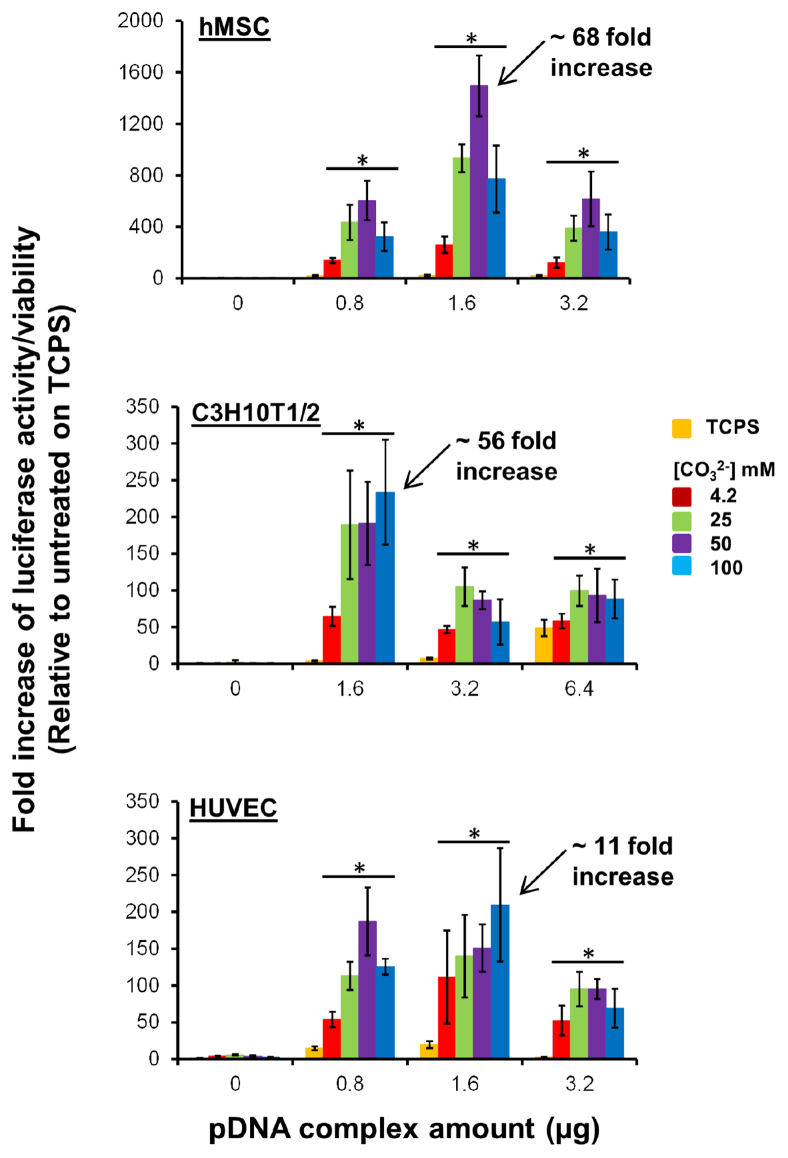
Figure 4. Optimization of transfection of multiple cell types.
Specified amounts of pDNA complexes were adsorbed on mineral coatings formed in 2 × mSBF with various [CO32−]. Luciferase activity was measured after 2 days of transfection of hMSCs (n = 6), C3H10T1/2 cells (n = 3), and HUVECs (n = 6). * indicates significant difference compared to TCPS condition by Student's t-test with p < 0.05. All data was normalized to TCPS with 0 μg of pDNA complexes. Arrow indicates the condition that presents the highest luciferase activity calculated by normalizing the highest luciferase activity to the luciferase activity from TCPS at the same pDNA complexes amount. Luminescence was measured at different time point when compared with that measured in Figure 3.

