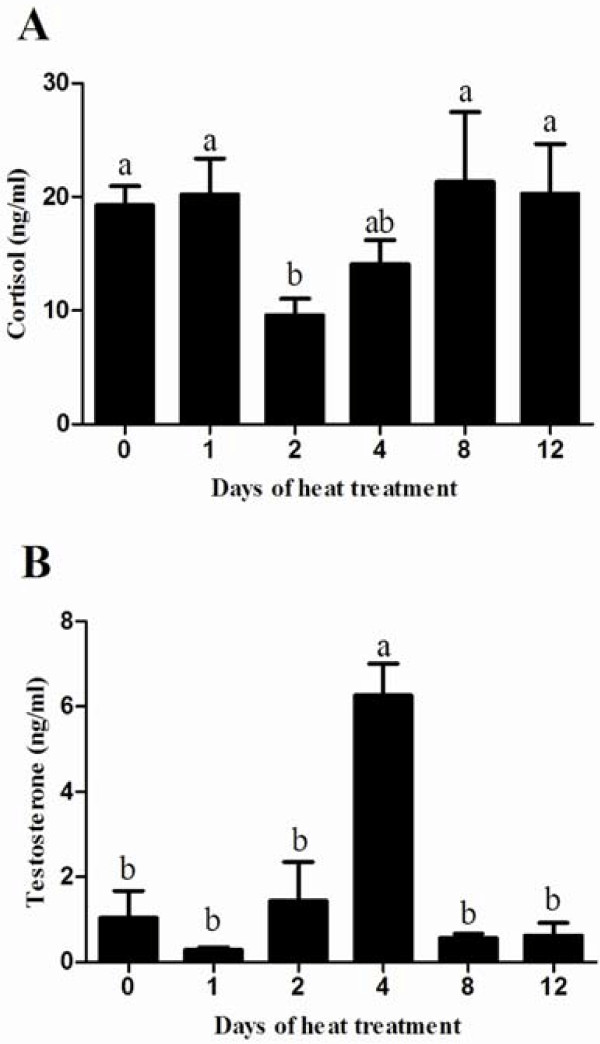
Figure 3.
Effects of heat treatment on serum cortisol and testosterone in mice. The concentrations of cortisol (A) and testosterone (B) in serum were measured on days 0, 1, 2, 4, 8 and 12. Each bar represents the mean ± SEM (n = 5). Different superscripts above bar differ significantly between each other (P < 0.05).

