
Figure 4.
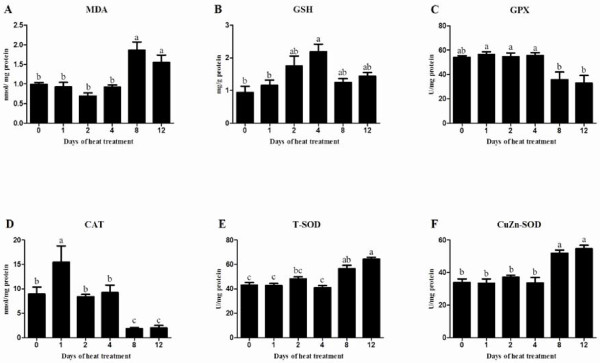
Effects of heat treatment on oxidative stress parameters in the testes of mice. The parameters (A, MDA; B, GSH; C, GPX; D, CAT; E, T-SOD and F, CuZn-SOD) were measured on days 0, 1, 2, 4, 8 and 12. Each bar represents the mean ± SEM (n = 5). Different superscripts above bar differ significantly between each other (P < 0.05).