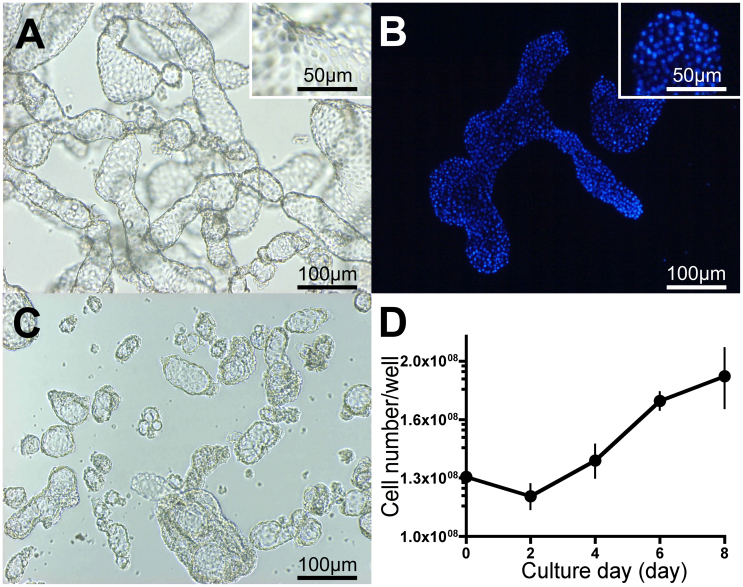
Figure 1. Morphology and growth capacity of Tc81 cells.
(A) Phase contrast micrograph of Tc81 cells forming vesicles. (B) Fluorescence micrograph of Tc81 cells stained with DAPI. (C) Phase contrast micrograph of vesicles disrupted by centrifugation and pipetting. (D) Growth curves of Tc81 cells after 120 passages. The cultures were maintained at 25°C. Mean ± SD (n = 4).

