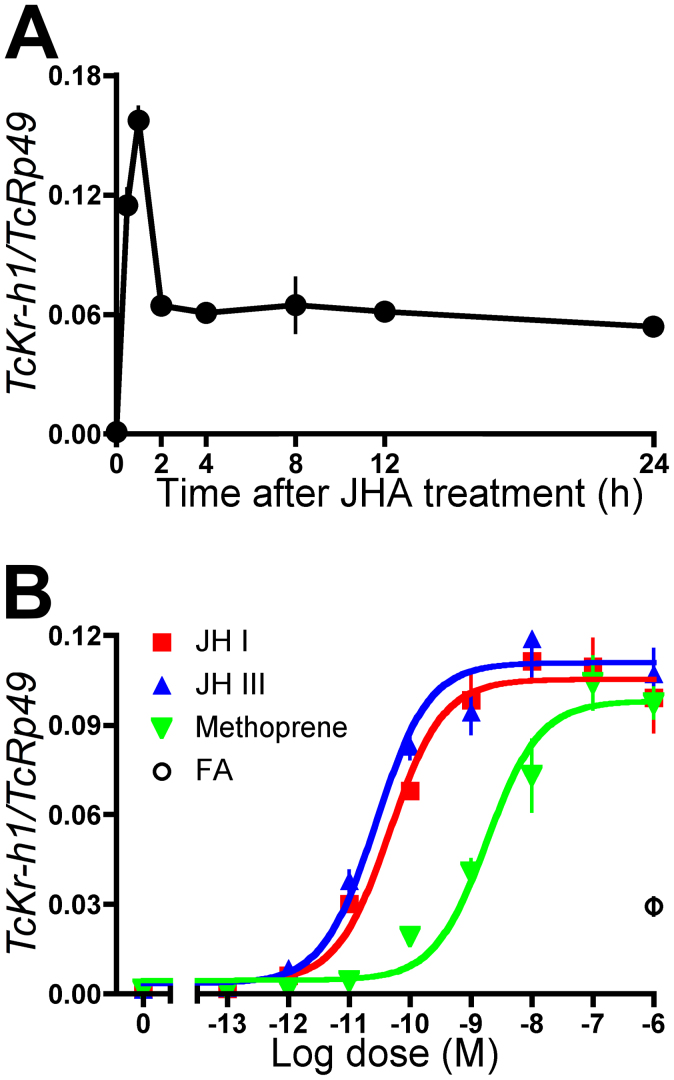
Figure 3. Induction of TcKr-h1 transcripts by JH in Tc81 cells.
Transcript levels of TcKr-h1 were determined by qPCR (mean ± SD, n = 3). (A) Cells were treated with 10 μM methoprene (JHA), and temporal changes in TcKr-h1 expression were monitored. (B) Cells were treated with different concentrations of JH I, JH III, JHA, or farnesoic acid (FA), and the expression levels of TcKr-h1 were determined 2 h after treatment.

