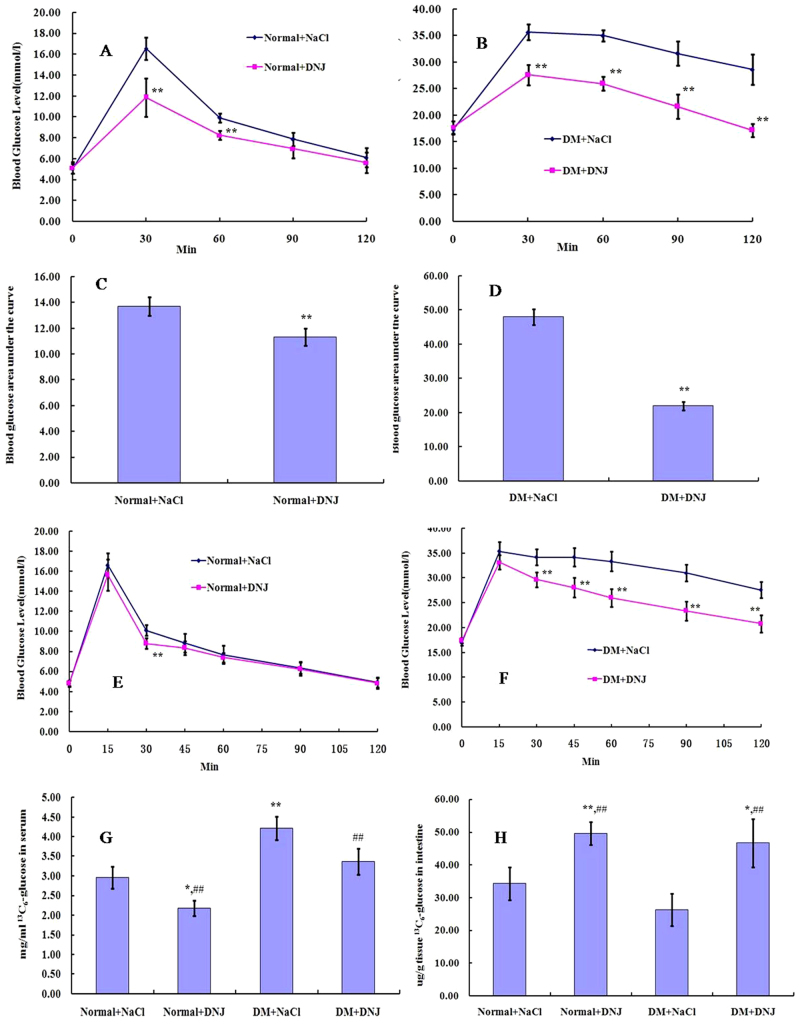
Figure 2. Oral glucose tolerance test (OGTT), intravenous glucose tolerance test (IVGTT) and labeled 13C6-glucose uptake assay.
After an overnight fast (16 h), normal and STZ-induced diabetic mice were intragastrically administered with equal volumes of 0.9% saline or DNJ (50 mg/kg b.w/d). 15 min later, a 30% glucose solution (3 g/kg) was orally administered for OGTT and 30% glucose solution (1 g/kg) was injected at the base of the tail vein for IVGTT. Blood samples were collected from the tail tip vein 0, (15), 30, (45), 60, 90, 120 min after glucose challenge. Results represent OGTT in normal (A) and diabetic mice (B), and the corresponding calculated relative area under the curve (AUC) for glucose concentration (C, D). IVGTT results are shown in normal (E) and diabetic mice (F). 13C6-glucose concentrations in serum and intestine are shown in G and H, respectively. Results are expressed as means ± SD (A–F, n = 10; G and H, n = 5 per group). *P < 0.05 and **P < 0.01 vs control groups.

