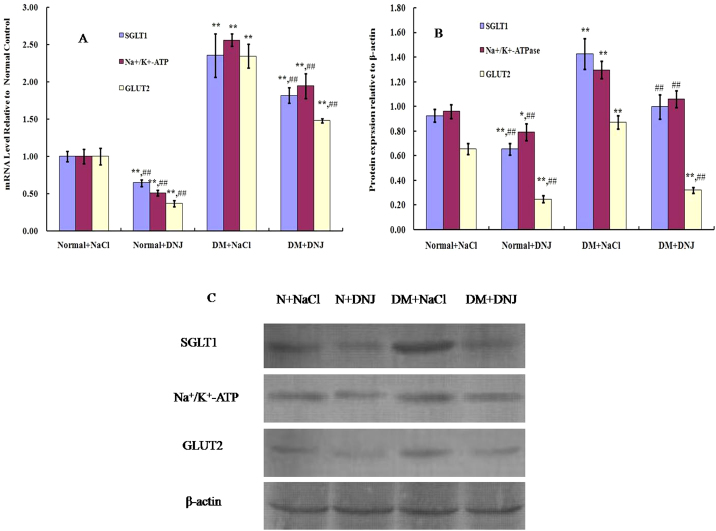
Figure 3. SGLT1, Na+/k+-ATP and GLUT2 expression analysis in small intestine.
Panel A shows RT-PCR analysis of SGLT1, Na+/k+-ATP and GLUT2 mRNA expression in normal (N) and diabetic mice (DM) with or without DNJ pretreatment. Panel B and C shows western blot analysis of SGLT1, Na+/k+-ATP and GLUT2 protein expression in the following groups: Normal + NaCl + Glucose (N + NaCl), Normal + DNJ + Glucose(N + DNJ), DM + NaCl + Glucose (DM + NaCl), DM + DNJ + Glucose (DM + DNJ). Western blot results were quantified using image J software (National Institutes of Health, USA). Density values were normalized to β-actin. Data are mean ± SD for three experiments per group. *P < 0.05, **P < 0.01 vs Normal; #P < 0.05, ##P < 0.01 vs DM.

