Figure 2.

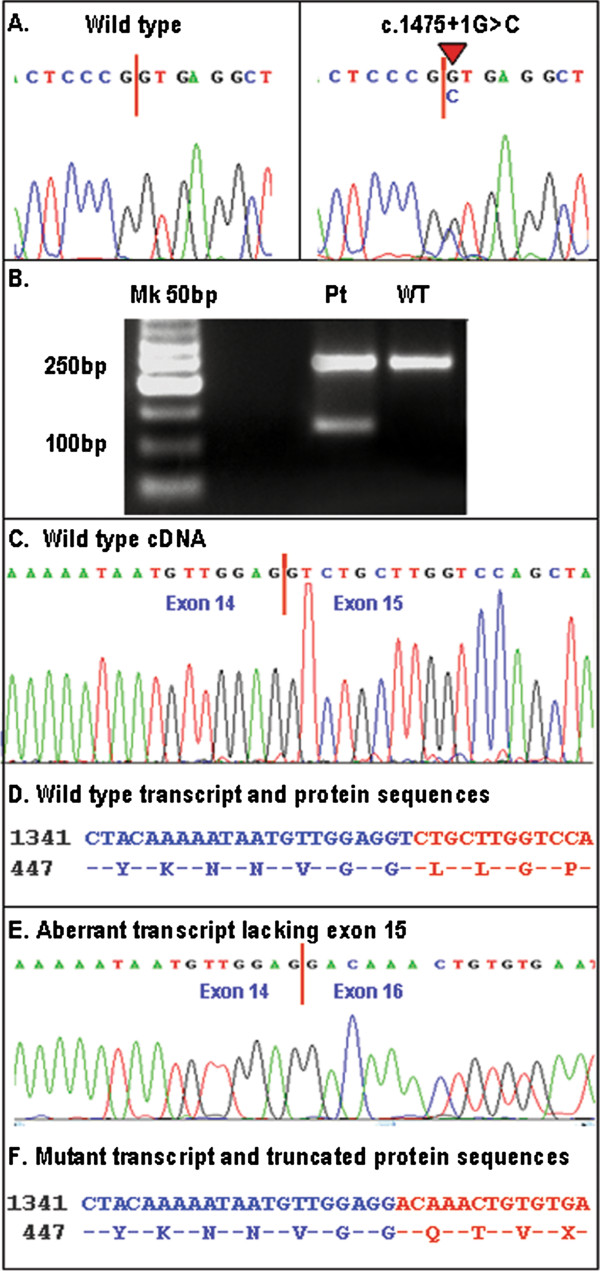
EYA1 mutational analysis. (A) Electropherograms of wild type (left) and mutant (right) EYA1 sequences. (B) RNA analysis by RT-PCR on wild type (WT) and proband fibroblats (Pt): an aberrant transcript of 121 bp was present in Pt line. (C) Electropherograms of wild type transcript. (D) Wild type cDNA and protein sequence. (E) Electropherograms of aberrant transcript lacking exon 15. (F) Mutant transcript and protein sequences.
