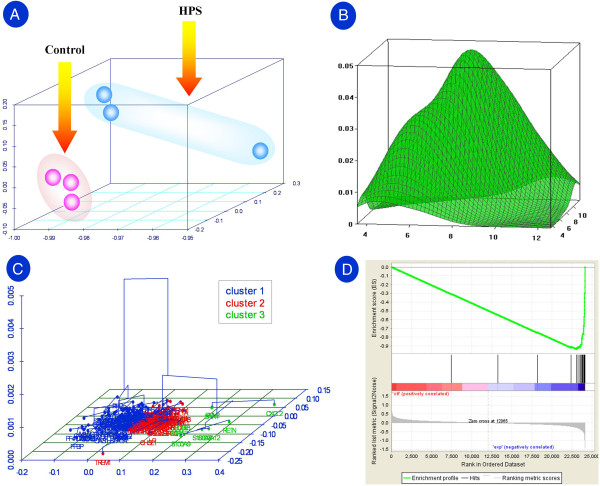
Figure 1.
Exploratory multivariate evaluation of the immunogene dataset. (A) 3D plot of samples under the coordinates of the first three principal components. (B) Evaluation of joint densities: an example for the 3D plot of joint density between samples 2 and 6. (C) Hierarchical clustering on the factor map for immunogenes: 3D dendrogram of the first principal component. Here, the optimal level of division calculated suggests three clusters. (D) Enrichment plot for the gene set with the largest positive loadings on the second principal component. Profile of the running ES score and positions of GeneSet members on the rank-ordered list.

