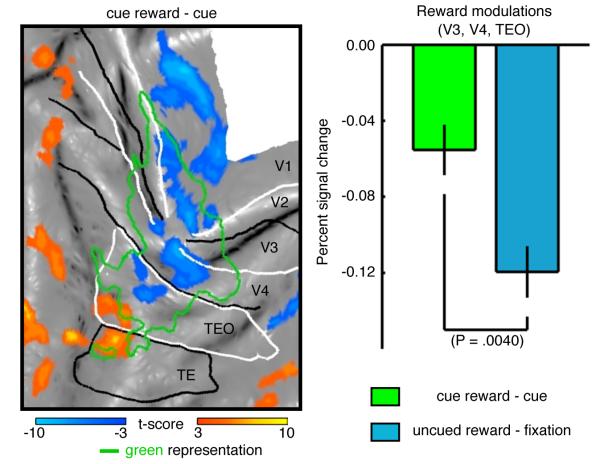
Figure 3. Comparison of reward modulations during cued & uncued trials.
(A) Reward modulation during cued trials projected onto a flattened representation of left occipital cortex (cue reward – cue, P < 0.001, group-level analysis, 181 runs, M13 - 61 runs, M18 - 62 runs, M19 - 58 runs) and the cue-representation (see Table S1). (B) Group mean reward modulation PSC within the cue-representation (V3, V4 and TEO, see Table S1) during cued (cue reward – cue) and uncued trials (uncued reward – fixation). Error bars denote the SEM across runs. Significance determined using Wilcoxon rank sum test.

