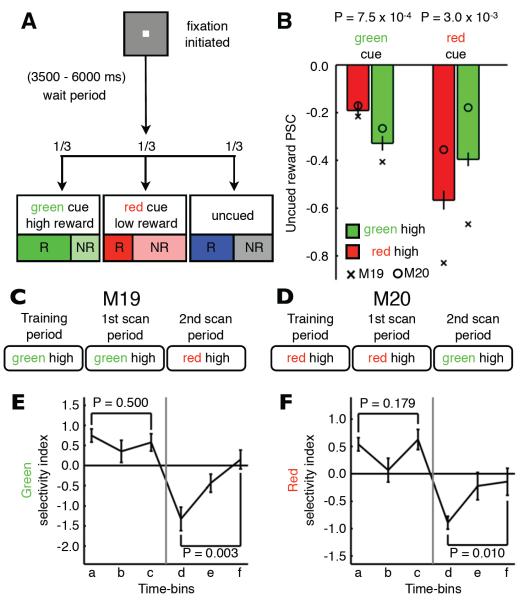
Figure 6. Cue-reward relationships modulate uncued reward activity in visual cortex.
(A) Design of cue–value experiment (experiment 4) (green, high reward-probability example, 66% green cue rewarded (R), 66% red cue not rewarded (NR), 50% of uncued trials rewarded). (B) Mean PSC during uncued rewards (uncued reward - fixation, 117 runs, M19 - 66 runs, M20 - 51 runs) measured within the green (left) and red (right) cue-representations (see Table S1). Bar color indicates the high reward-probability cue. Error bars denote SEM across runs. Symbols denote the mean PSC of individuals [M19 (cross); M20 (circle)]. Wilcoxon rank sum test compared PSC during green and red high reward-probability scan periods. The timeline of the cue-reward relationships that (C) M19 and (D) M20 were exposed to during the training phase and first and second scan periods. (E) Mean green-cue selectivity index over the timecourse of the experiment (M19, 2 scan periods, 3 time-bins/scan period, 22 runs/time-bin). (F) Mean red cue selectivity index over the timecourse of the experiment (M20, 2 scan periods, 3 time-bins/scan period, 17 runs/time-bin). In both (E) and (F), error bars denote SEM across runs and significance was determined using Kruskal-Wallis non-parametric ANOVA across the three time-bins in a given scan period. See also Table S5 and Figure S5.

