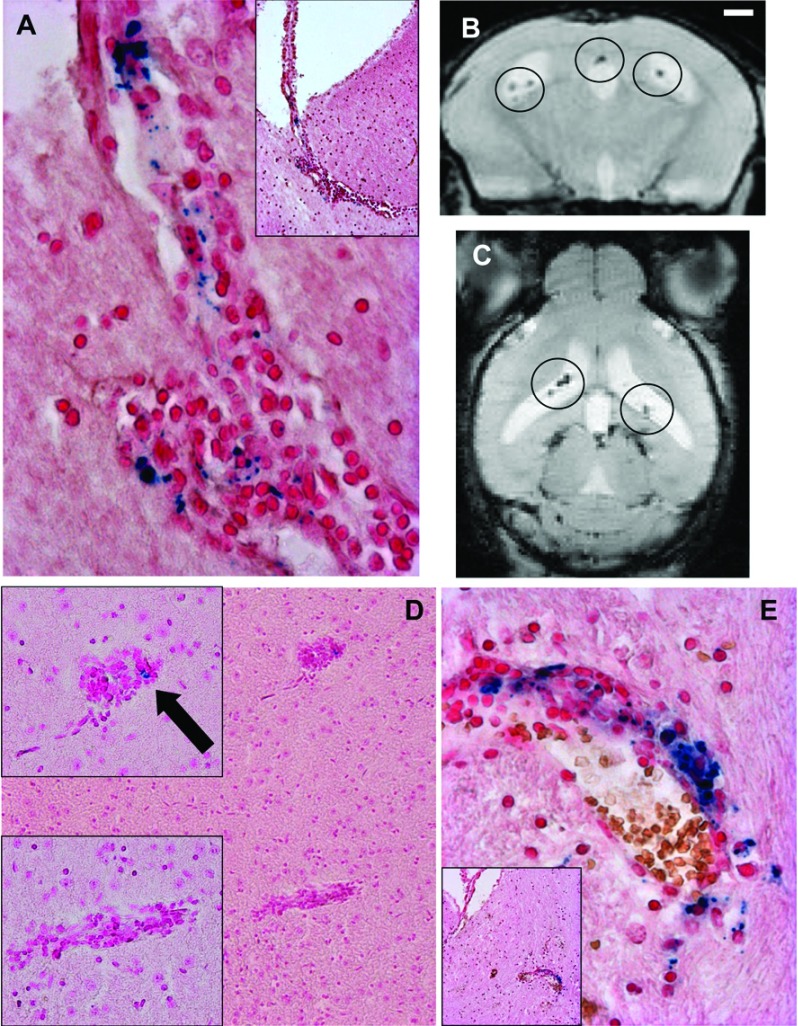
Figure 5. VSOP observed in both severe and mild inflammatory lesions.
At peak disease VSOP was detected by histology in inflamed choroid plexus extending from the lateral ventricle into the interventricular foramen (A), and could also be seen as hypointensities on coronal (B) and axial (C) T2*-weighted images. Representative examples of mild inflammatory lesions that were both VSOP-positive (arrow) and VSOP-negative were seen in brain parenchyma (D). A representative example of a more severe inflammatory lesion showing the presence of VSOP as well as erythrocytes (brown) is shown in (E). Original magnification: (A, E) ×200; (D) ×100. Scale bar (B)=1 mm.

