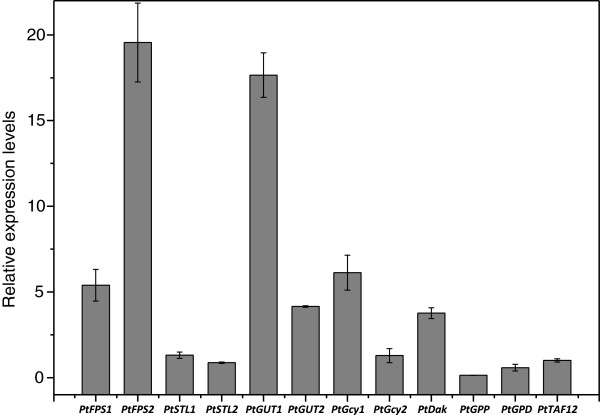
Figure 2.
Relative expression levels of glycerol metabolism related genes in P. tannophilus on glycerol compared to that on glucose. The estimation of relative expression levels was based on 2-ΔΔCT, where ΔΔCT = (CT gene of interest - CT internal control) sample A - (CT gene of interest - CT internal control) sample B. CT represents the cycle number at which a sample reaches a predetermined threshold signal value for the specific target gene. All the experiments were performed in triplicate.

