
Figure 3.
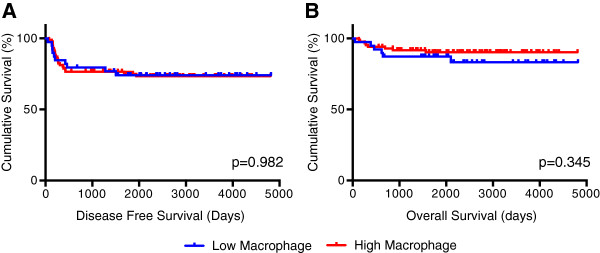
(A) Disease-free and (B) overall survival comparisons of patients with low and high macrophage count densities. Logrank analysis was used to compare survival differences between the two populations.
Official websites use .gov
A
.gov website belongs to an official
government organization in the United States.
Secure .gov websites use HTTPS
A lock (
) or https:// means you've safely
connected to the .gov website. Share sensitive
information only on official, secure websites.
(A) Disease-free and (B) overall survival comparisons of patients with low and high macrophage count densities. Logrank analysis was used to compare survival differences between the two populations.