
Figure 5.
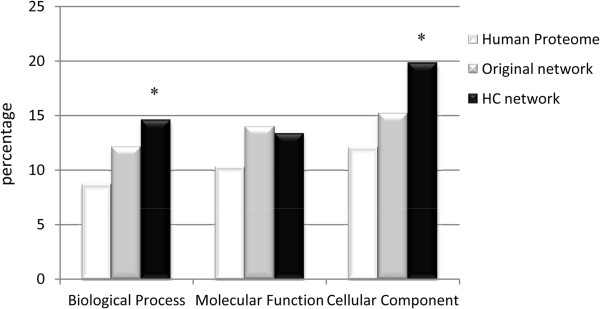
Fraction of proteins pairs sharing a GO annotation cluster. Each bar represents the fraction of proteins pairs that share a cluster within each of the three GO categories (biological processes, cell components or molecular functions; percentage indicated). Asterisks above the bars indicate an observed value statistically different from the one expected in the Human proteome dataset (Chi-2 test, P<0.05).