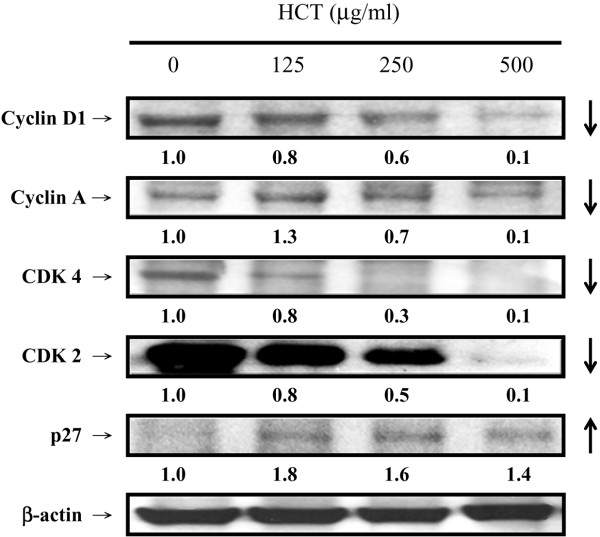
Figure 4.
Effects of HCT on G0/G1 relative protein levels in A549 cells. A549 cells were treated with HCT (0, 125, 250 and 500 μg/ml) for 24 h and then performed western blotting analysis for Cyclin D1, Cyclin A, CDK4, CDK2, and p27 in HCT treated cells as described in Materials and Methods. The experiments were performed in triplicate (n = 3).

