Figure 2.

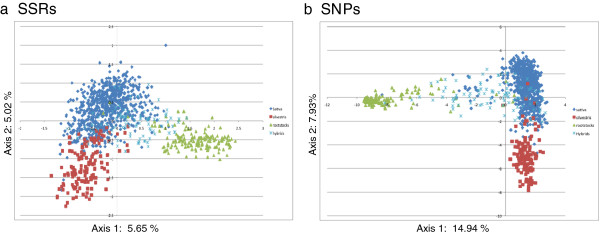
Scatter plot from a PCA. Principal component analysis of the FEM grape germplasm collection based on (a) 22 SSR loci and (b) 353 SNP loci.

Scatter plot from a PCA. Principal component analysis of the FEM grape germplasm collection based on (a) 22 SSR loci and (b) 353 SNP loci.