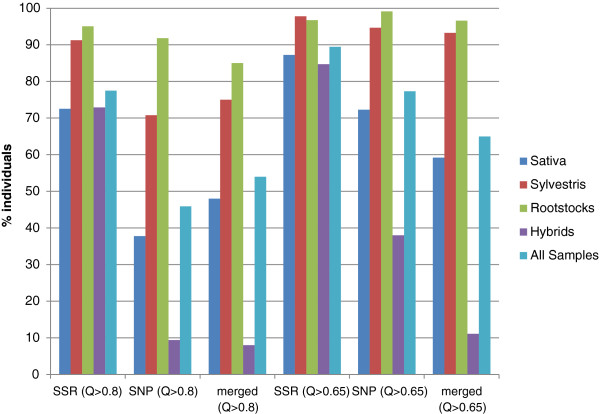
Figure 4.
Comparison of membership in germplasm clusters based on marker class. The percent of individual assigned at K = 5 with different thresholds of membership coefficient (Q > 0.8 and Q > 0.65) is reported for each marker class separately and for the common accessions assigned using both marker datasets (merged).

