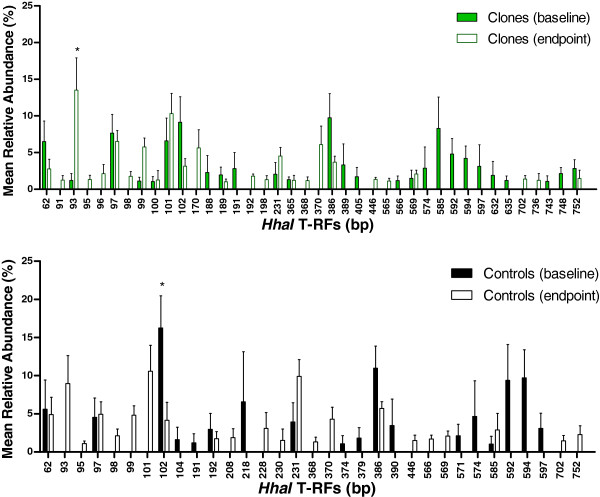
Figure 3.
The abundance of bacteria at baseline and endpoint. Mean relative abundance of the most predominant T-RFs (>1%, bp) in the fecal samples of cloned pigs at baseline (green square) and endpoint (□ ) and in non-cloned control pigs at baseline (■ ) and endpoint (□ ). The error bars represent standard error of the mean (SEM).

