Figure 7.
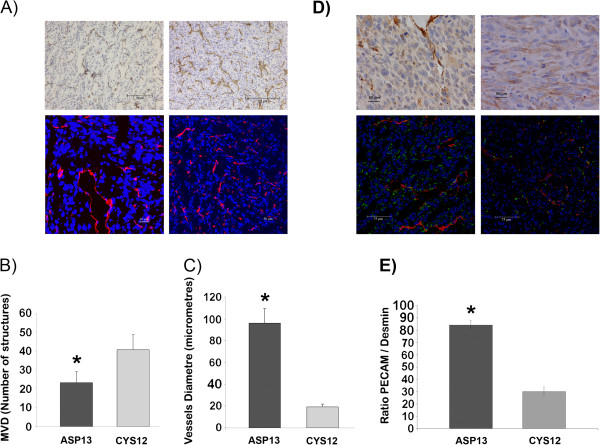
Vessel number in ASP13 and CYS12 subcutaneous tumours. A) PECAM immunohistochemistry (up) and PECAM immunofluorescence (bottom) staining of subcutaneous tumours are shown as a representative example of each tumour mutation group. (ASP13 on the left and CYS12 on the right). B) Microvessel density (MVD) was represented as number of vessels structures PECAM+/microfield at 400X. (CYS12 40.8 ± 8 vs ASP13 23.7 ± 6 number of PECAM (+) vessels; P = 0.002). C) Mean of vessel diameter is shown in each bar. (ASP13: 96,4 ±12,9 μm vs CYS12: 19.3 ± 2.8 μm; P < 0.0001). D) Representative staining of ASP13 (left) and CYS12 (right) tumour tissues are shown. Up: αSMA of paraffin tumour tissue. Bottom: PECAM/Desmin staining on cryopreserved tumour tissue. Positive mural cells were more evident in ASP13 tumours. E) PECAM/Desmin ratio analysed by LEICA software was represented. Ratio was higher in ASP13 tumours (P < 0.0001).

