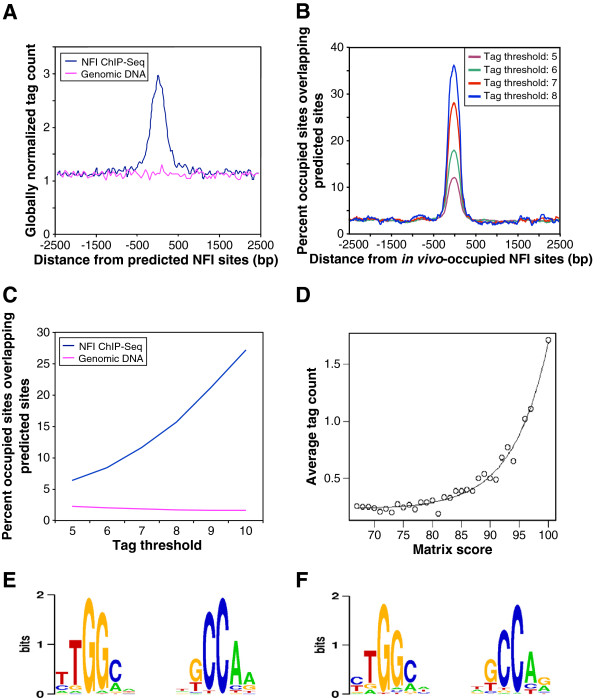
Figure 1.
Correlation of modeled NFI binding specificity to genomic binding site occupancy. (A) Density of NFI ChIP-Seq tags in the vicinity of NFI sites predicted by the weight matrix derived from in vitro NFI binding studies. A score threshold of 90 yields 12,209 predicted sites on the mouse genome. Average ChIP-Seq tag counts were calculated in windows of 50 bp for a region of 2.5 kb on each side of the predicted sites. Tag counts were normalized globally as a fold-increase over the genome-wide average tag count in 50 bp windows. (B) In vivo-occupied NFI sites were defined with different tag thresholds: 8 tags yielding 701 sites, 7 tags – 1,642 sites, 6 tags – 4,794 sites, 5 tags – 14,487 sites. The percentage of in vivo NFI sites matching a predicted site was plotted as a function of the distance to the center of the in vivo-occupied sites in windows of 300 bp. NFI predicted sites were defined with the cut-off of 79. (C) Correlation of the tag threshold defining NFI site occupancy and weight matrix predicted sites, defined as fraction of in vivo sites that are overlapping a predicted site. (D) Exponential relation of the average tag count with the score of the position weight matrix. Tags were attributed to the predicted sites as follows: plus strand tags were attributed to the closest downstream predicted site if they were separated by less than 200 bp and minus strand tags were similarly attributed to the closest upstream predicted site. The average tag count was defined as the ratio of the overall tag number covering the predicted sites for a certain class and the number of predicted sites of the class. (E) In vitro NFI binding motif derived from 5579 NFI binding sequences of 25 bp in length obtained from SELEX-SAGE selection [29]. (F) In vivo NFI binding motif derived from 1265 NFI binding sequences of 200 bp in length, obtained from the ChIP-Seq experiment.

