Figure 7.

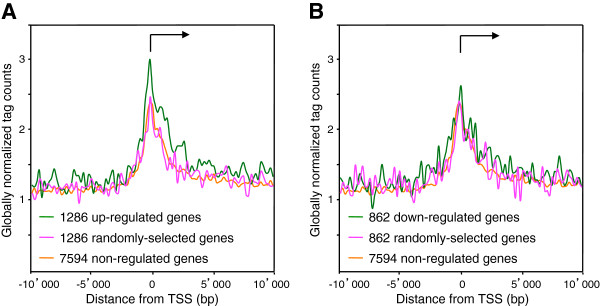
Transcription start sites of NFI-C up-regulated genes show the highest occupancy with NFI. (A) Genes were considered to be up-regulated by NFI-C if the difference in Affymetrix expression levels between wild-type and NFI-C knock-out cells was greater than 0.5. We found 1286 genes to be up-regulated by NFI-C. As a negative control we used 1286 randomly chosen genes. (B) Genes were considered to be down-regulated by NFI-C if the difference in Affymetrix expression level between wild-type and NFI-C knock-out cells was lower than −0.5. We found 862 genes to be down-regulated by NFI-C. As a negative control we used 862 randomly chosen genes. In both graphs we used as a negative control NFI-C non-regulated genes with the change in Affymetrix expression level between −0.05 and 0.05. Average NFI ChIP-Seq tag counts were calculated in windows of 200 bp for regions 10 kb up- and down- stream of the oriented transcriptional start sites (TSS). TSS were oriented and the broken arrows indicate the initiation site and the direction of transcription. Tag counts were normalized globally, as a fold-increase over the genome average tag count in a window of 200 bp.
